
Hi, I get the graph below when I look at the TCP window for a conversation from our branch site and a very slow speed. The link is 100mbs Full duplex but from A to B i can get the full 100mbs, but from B to A I only get ~10mbs and this strange shaped graph. I have a PC attached to the router at side B which I am sending the file from, and am taking the capture from the in comming port in to the router/switch (using a 6500 to do the routing) at side A. the Graph from A to looks normal with the window size climbing till it hit the bandwith and then dropping a little and climbing back again. Any one got any ideas?
asked 25 Nov '14, 09:20 DevilWAH showing 5 of 9 show 4 more comments |
One Answer:
So this is a capture between 185.134 and 185.133 using TTCP to run a TCP throughput test.
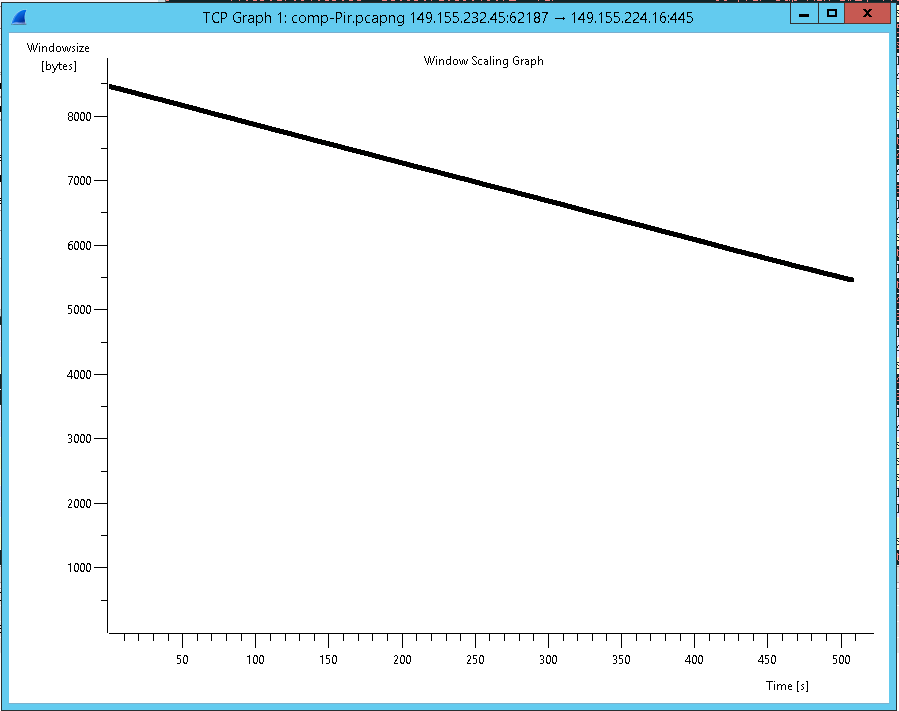
That is an indication that the receiving application is not keeping up with reading the data. Where it says "previous segment not captured" is this just out of order packets or are packets getting lost? Packets are arriving out of order, look at the ip.ids , there is not a single retransmission in the trace "well the issue is the same, the TCP windows is very volatile and through put is poor." The issue is 'poor performance' between 149.155.232.45 and 149.155.224.16 because of a steadily shrinking windowsize offering? If this is it, please provide a capture of the issue. Regards Matthias answered 09 Dec '14, 23:10 mrEEde See packet 598 in the capture, .133 resets its window and then ramps back up, this is repeated 9 or 10 times in 5 seconds. (I exported the section here https://www.cloudshark.org/captures/c0545d04feae) If I connect the laptops directly with a cable then they don't see any out of order packets and run at 700+mbs, so it is not that the receiving application is not able to keep up. As for the 149.155.232.45 and 149.155.224.16, as I mentioned this is a 700+megabyte file and shows the same issues as the shorter one I have posted. I should have used the term volitial TCP window rather than shrinking.The issue is the same no matter what end devices I test between that are on different sides of our wan link, Test from A to B run at 100mbs while test B to A run at ~10mbs. So this is a WAN link issue not device/application issue. (11 Dec '14, 05:20) DevilWAH Well, shrinking window-size is an indication that data arrives faster at the receiving TCP than the reading application is consuming it. The fact the tcp receive buffer is just 32K in your scenario does not leave much room for a continuous flow and it will certainly come to a (close to) Window-Full condition. (frame.time_delta gt 0.02 and ip.src == 183.217.185.133) or tcp.analysis.window_full The out of order arrivals are not due to packet loss as the missing packets are following suit within the same instant and the ip.id suggests the were leaving the sending side 'in order' and are NOT retransmissions. So as there is not much network between the communicating partners the are out of order when they left the sending 6500 router. This might be due to EtherChannel protocol (11 Dec '14, 22:04) mrEEde Hi, thank you for that explanation, Just one thing, the packets are being sent from the 3845 side of the link which is a router so I can see any reason that it would be a Ether-channel issue. The 3845 seems to think it is sending the packets in order. the queuing is set to FIFO and a "embedded Packet capture" on the 3845 on the outgoing interface shows all the packets are in order. This then passes in to the NTE of our ISP, thorough vodafone and BT network and then back out to our 6506. Vodafone have told me that half way through the link they are seeing the out of order packets. SO it seems the first leg of the trip is where the issues is happening. (15 Dec '14, 03:21) DevilWAH |
can you provide a capture file?
yes just working out how to upload it :)
O.K. and do you mind to share the link with us? ;-)
@DevilWAH You'll need to upload the capture file to a public sharing site, e.g. Cloudshark, DropBox, Google Drive etc.
https://www.cloudshark.org/captures/83068439f326
Sorry was just finding some where to put it.
So this is a capture between 185.134 and 185.133 using TTCP to run a TCP throughput test.
I see at packet 598 that the receiving station resets the TCP window to 1460, before ramping up again and this seems to keep repeating.
Where it says "previous segment not captured" is this just out of order packets or are packets getting lost?
The connection of the screenshot (sourc/dst port) is NOT in the capture file you posted!
sorry you are correct the posted capture is not the same as the attached graph. The reason is that the capture I made the graph from is 700mbytes. However the out of order packets and other errors I am seeing are the same in both captures.
O.K. but then what is your question and which data set (screenshot or capture file) shall we use to answer it?
well the issue is the same, the TCP windows is very volatile and through put is poor.
the graph is the issue seen averaged over half a million packets, while the capture is the same but over a much smaller sample size (due to upload limits)
I think the capture files is the one that shows the packet by packet issue. and the question is still what is causing the slow transrfer speeds? is it TCP window, and if so is it outof order packets/ dropped packets or something else?