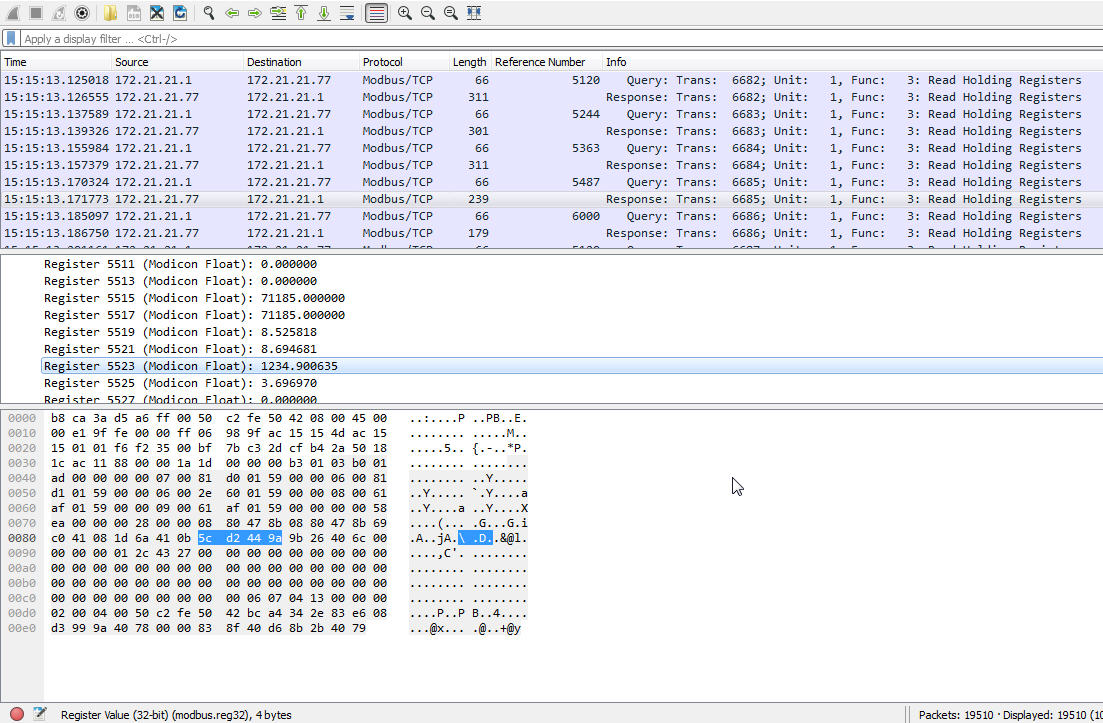
I am using the Matlab script pcap2matlab.m to create a time plot of a Modbus register. (The Matlab script calls TShark). In Wireshark I can see the parameter I want: To plot this Modbus register as a function of time I am using pcap2matlab.m. I created a simple script to call pcap2matlab.m for this purpose. This script is listed below: %pcap2matlab_example2() isRead = true; CAPTURE_FILE = 'REL2_test02_onOffHVPW.pcapng'; %% Set up the capturing/reading parameters: dissector = {'modbus.func_code',... 'modbus.request_frame',... 'modbus.byte_cnt',... 'modbus.reg32'}; capture_filter = 'tcp and src port 502'; And it works, I get a result for each packet in a Matlab structure array! However, it gives me all the Modbus registers for a given packet combined as a single large decimal, like 5.1205e+247. How can I extract the Modbus register I want from this large decimal (i.e. Register 5523 = 1234.900635 in the image above)? asked 24 Feb '17, 12:54 bmain57 closed 27 Feb '17, 07:45 cmaynard ♦♦ |

This is a static archive of our old Q&A Site.
Please post any new questions and answers at ask.wireshark.org.
This question is a duplicate of https://ask.wireshark.org/questions/59670/extract-particular-register-from-series-of-modbus-packets and will be closed.