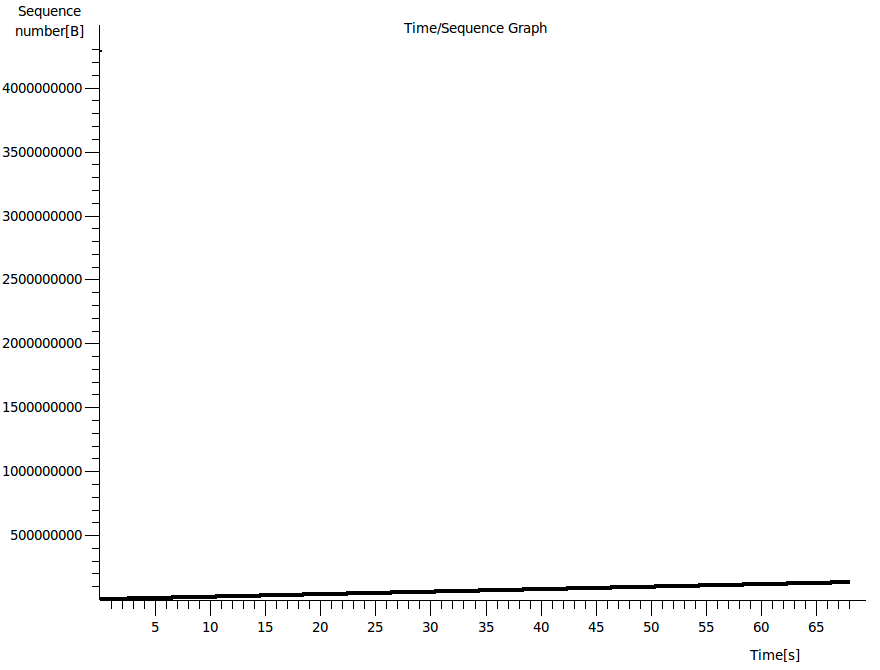
Hi all!! Please, see attached graphs. 1. How to zoom on the graphs? I haven't got middle mouse button, then I used the '+' and '-' keys to zoom in and out, but I get nothing. 2. How to change the values of X and Y axes on the graphs to values more appropriate for me? Please, see Time/Sequence Graph. 3. Why do I get horizontal lines on the RTT graph? Please, see Round Trip Time Graph. Thanks!! Regards, Rocío.
asked 09 Jul '12, 02:08 Rocio |
One Answer:
'+' and '-' do work with Wireshark 1.8.0 (Win7 64 Bit). You can also try 'i' (zoom in) and 'o' (zoom out). Then scroll with cursor: left/right/up/down. (Click Help button of the TCP graph control window). What is your Wireshark version? HOWEVER, the mouse commands do not work with Wireshark 1.8.0 (Win7 64 Bit) on my system!?!
You can't without changing the code.
that's interesting. The RTT graph is calculated based on the timestamps in the capture file. The only 'plausible' explanation I can imagine (at the moment) is a problem with the way the timestamps are created. If the OS on which you captured the data is 'busy' that might create timestamp pattern. However I would expect a more diffuse pattern and not 8 straight lines. But then: If you could zoom in, you might discover, that the lines are not THAT straight. Just a wild guess: Did you capture within a virtual machine? If no: any other special 'configuration' on that machine? Regards answered 16 Jul '12, 13:29 Kurt Knochner ♦ |


Thank you very much for your response Kurt!
My Wireshark version is 1.2.7. It is a very old version and I guess that in it I cannot zoom in/out. I will install a newer version. I am working with a pcap file, but I use Wireshark only for getting graphs and statistics, I don't capture traffics with Wireshark.
Thanks!
Regards, Rocío.