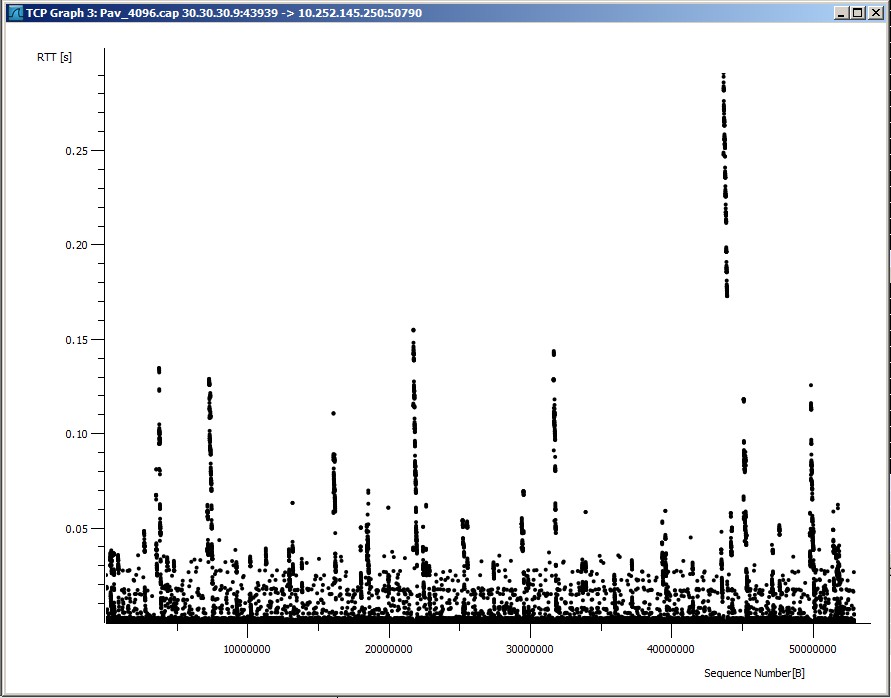
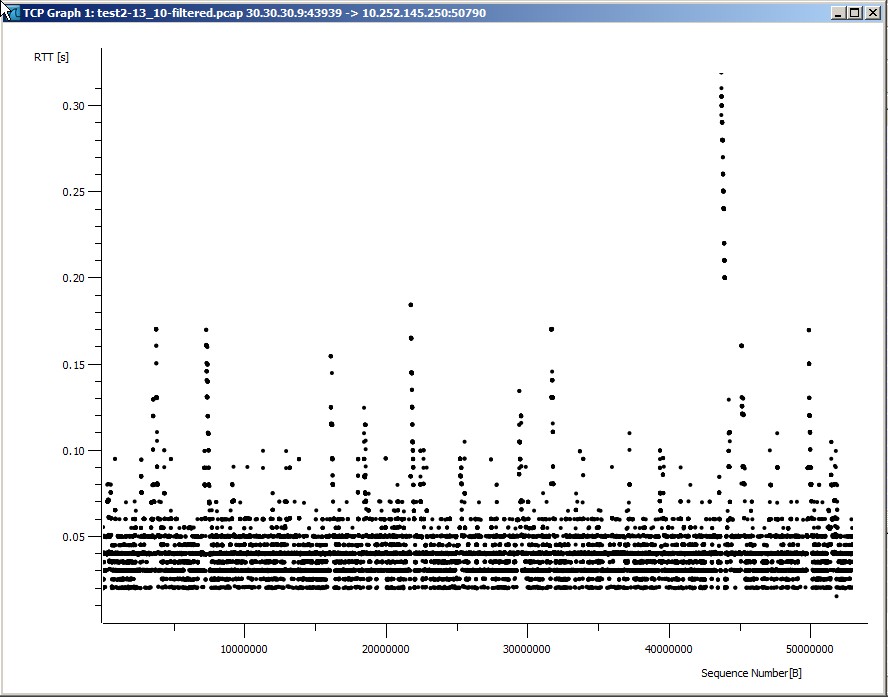
Hi! What is the reason of this kind of RTT graph? BR. asked 26 Nov '12, 00:13 Nurik |
2 Answers:
The vertical "lines" in your RTT graph might be wrongly assumed high delay packets, when wireshark is checking a certain sequence number for the time it takes TCP to ACK the data. When you have packet loss, this can be a typical graphical outcome of wireshark interpreting constant ACK numbers while waiting for a retransmission of lost data. That could in theory also explain why your UDP transfer gets higher throughput, if the UDP application doesn't care for packet loss, while TCP very well does - check for tcp.analysis.flags answered 26 Nov '12, 02:06 Landi |
Looks pretty normal to me... you've got tons of times below 0.05 seconds, and sometimes it goes up when there is contention, which is caused by buffering delays. answered 26 Nov '12, 00:22 Jasper ♦♦ Thank you, but how it can be solved? Previous RTT graph was made on client side logs. I think i have low throughput due to this delays. Below RTT graph of same session from point closer to server. (26 Nov '12, 00:35) Nurik and what it means "which is caused by buffering delays." ? BR (26 Nov '12, 00:36) Nurik Additional info regarding this issue, with UDP I'm getting 30Mbps, but with TCP no more then 10Mbps. (26 Nov '12, 00:38) Nurik |


can you please add a "Throughput Graph" and a "Time-Sequence Graph (tcptrace)".
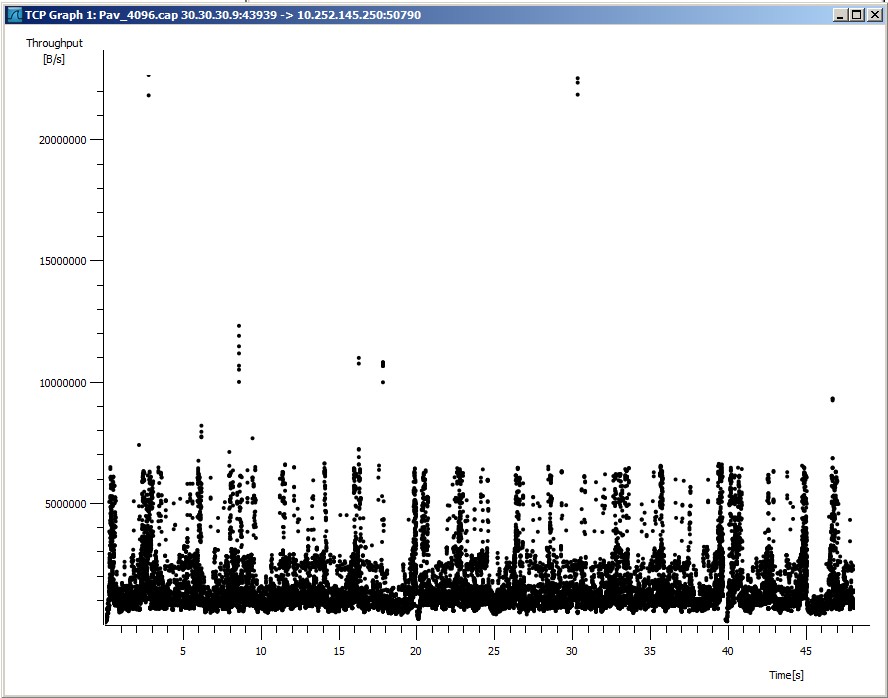
Throuput graph
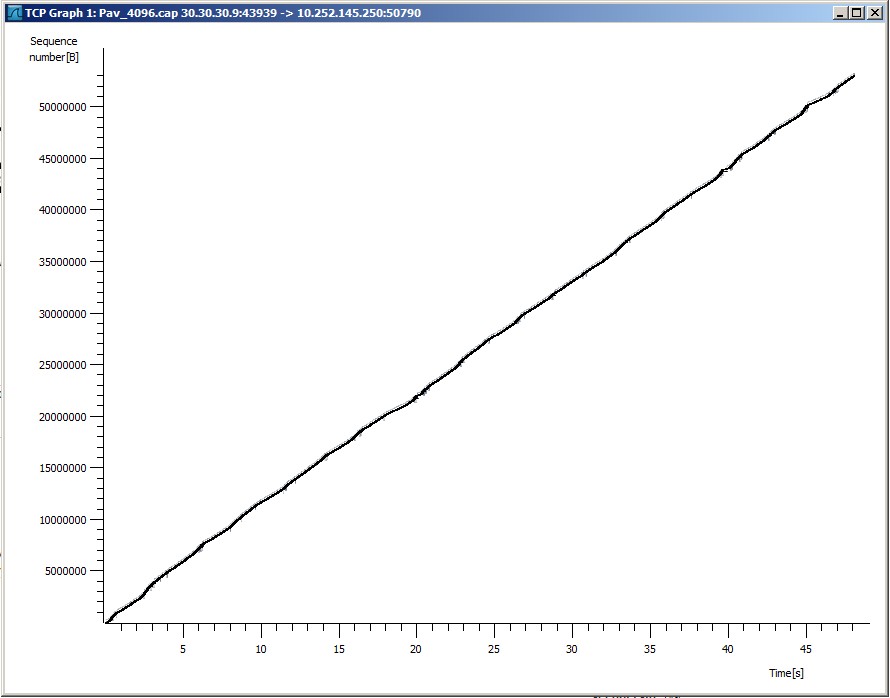
Time-Sequence Graph (tcptrace)