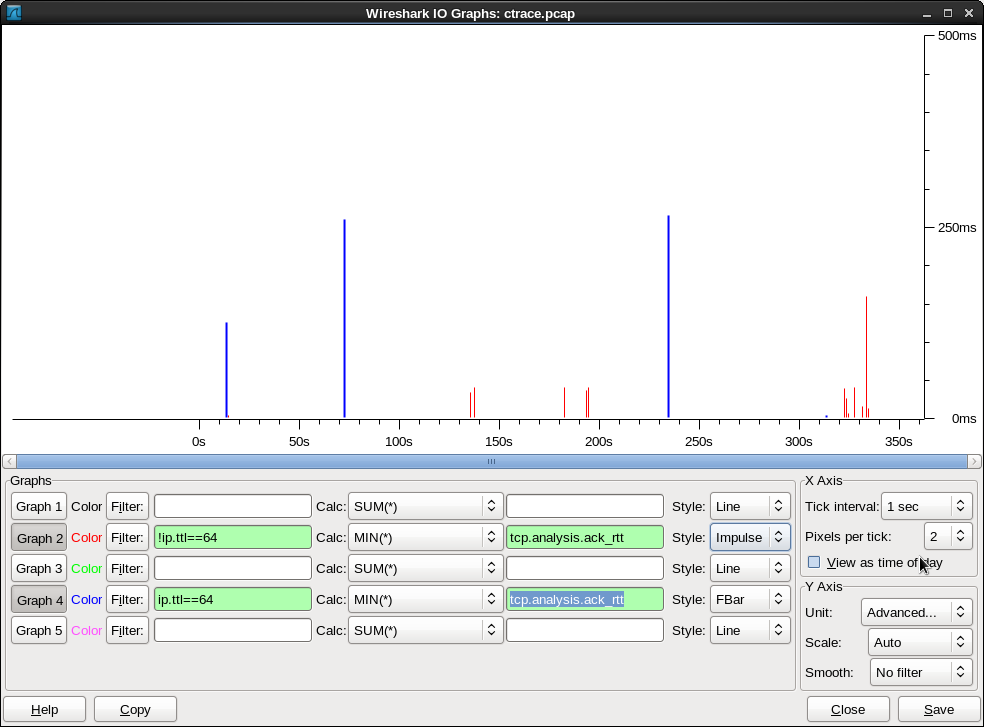
Hi, while using stream graph for rtt it shows a single point in graph for the selected packet.if i mark packets it shows pints for the marked packets in the graph. How to get graph for the whole pcap file or for a set of packets in the file? asked 05 Jun '13, 15:56 SThomas edited 05 Jun '13, 15:57 |
One Answer:
You can use Satistics IO Graph to draw the RTT over time for each or a filtered set of packets. Open Statistics IO Graph, change the Y-axis Unit to "Advanced". Here you can set the Calc: to MIN(*) and put "tcp.analysis.ack_rtt" in the field
answered 05 Jun '13, 22:18 mrEEde2 |

