Hello, I'm new to WireShark devolopment; forgive my noob question ;) I couldn't found it on this site, so I ask here. I'm able to build and run WireShark; I can also debug it in VS 2010. But i can't get rid of the red underlines in VS2010 under many functions. VS2010 can't find my source files. Is there anywhere a tutorial that describes how to import the source files from an existing executable, and setup the right folders? Second question: I add items to the tree with No I have three items, but I want it like this "Data %d contains %d on index: %d". Because i've multiple data items in one packet; I want it as small as possible. It must be possible; but how? Can someone explain this with an example? I really appreciate any help asked 03 Jul '13, 05:27 Johnny321 |
One Answer:
For the first item see Bills answer to this question (you did search before posting your question?) Edit: I actually use WinDbg for debugging as I only need to point it to the source files once and it then finds everything else. For the second (you should really raise it as a separate question as others won't be able to search for it easily) have a look at answered 03 Jul '13, 05:44 grahamb ♦ edited 03 Jul '13, 05:46 showing 5 of 7 show 2 more comments |

Hello Graham,
The answer in your links says this:
Once you've done the above you can use all the normal VS functionality to open source files, to do source level debugging actions such as setting breakpoints, starting and stepping through the program and so on...
I cannot open source files than; importing the created BSC doesn't change anything :(
The bsc is only for searching symbols (e.g, Find All References) and isn't need for debugging. All the debug info is in the pdb files.
Can't you open source files using "File | Open"?
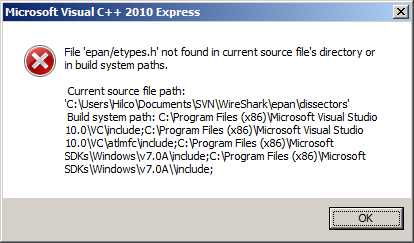
I can open the files, but I don't get the references OK. If i want to open 'packet.h' for example; I get this message:
I've already added WireShark folder to the 'include directories'.
Note that the dialog is looking for epan/etypes.h, but the source path list only includes epan/dissectors.
I don't think adding directories to the "Include directories" is what you want, maybe add the top level Wireshark directory to the solution properties Common Properties | Debug Source Files list.
How is doing other people this :S. I'm not used to use VS2010; but it's an impossible program. Have anyone a project file or something. This took me already a couple days, with no one step further.
Your "answer" has been converted to a comment as that's how this site works. Please read the FAQ for more information.
As mentioned above, for all the years I've been working on Wireshark, I've never used Visual Studio for debugging, I've used WinDbg.
After your question though, I tried VS 2010 Express and to my surprise it all worked, I could set a breakpoint in my dissector, and when the breakpoint was hit, could step through and VS would open the appropriate source files as required.
How I did this:
*I may, in the past, have modified the VS defaults for symbols. Currently, under Tools | Options | Debugging Symbols, I have a single entry for "Microsoft Symbol Servers", and a local directory to cache the symbols in. You'll need a working internet connection to cache the symbols the first time you start a debugging session, and it may take some time to download the symbol files so the first start may be slow. Check the "Output" window in VS to see the progress of loading the symbols. Subsequent runs (if the symbols are cached) are much quicker to load.
Note that this setup doesn't give you symbol cross-references, that is done by creating the .sbr files during the build as discussed in the other question I linked to.
@Johnny321: If a supplied answer resolves your question can you please "accept" it by clicking the checkmark icon next to it. This highlights good answers for the benefit of subsequent users with the same or similar questions.