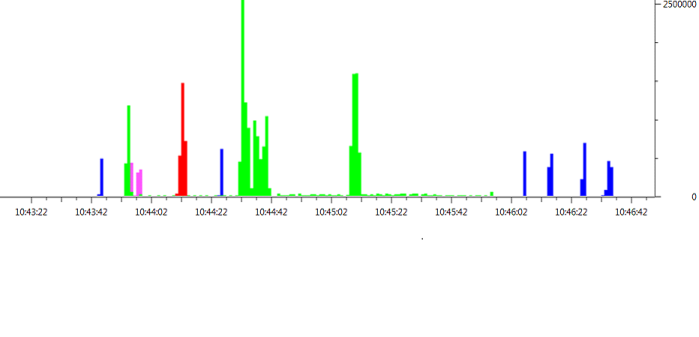
I have a total of T1 link that i was trying to analyze how bandwidth is been used by different applications. What I can see the default graph show a big line, suggesting how the total traffic was when the trace took. Ideally that line should be less than 1.54 Mbps - T1 speed. But i do see spikes above 1.54. What does it mean ? ..is it a burst in traffic. asked 29 Sep '13, 18:37 pappu |
2 Answers:
I assume you are not capturing on the T1 interface, but on an ethernet interface in the path between the end-systems and the router that connects to the T1 interface. Since the ethernet interface has a higher bandwidth, there can bursts with a higher bandwidth due to buffering on the router. If I was wrong in my assumption, please supply more details on where you did your capture and how you created your graph. answered 30 Sep '13, 14:34 SYN-bit ♦♦ |
By default IO graphs calculate the bandwidth (Bits/tick if you chose that) in both directions (inbound and outbound). So, if you want to check only your inbound utilization, you should use a display filter in the IO graphs and choose the local network for IP destination.
Regards answered 29 Sep '13, 19:11 Kurt Knochner ♦ Thank You Kurt, I have been using the ip.src and ip.dst filters. But still I see a spike in utilization that would go above the normal bandwidth. The big green spike that you see is the spike above the normal 1.5 Mbps of the actual T1 bandwidth.
(30 Sep '13, 09:06) pappu can you please add a screenshot of the IO graph settings? (30 Sep '13, 10:07) Kurt Knochner ♦ do you see frames larger than 1500 bytes? If so, your interface might support TCP offloading and Wiresharks calculation for the throughput will get corrupted by the large frames, as it thinks there are far more bits/s than are there in reality (several real frames in on large frame that wireshark sees) (30 Sep '13, 15:14) Kurt Knochner ♦ |


Hi SYN-bit. These T1 lands on a router after which I have a span port which is a Gig port which goes to my monitoring tool where I am taking this trace.
if you can elaborate more or have any good article that I can read that will be very helpful.
Imagine sending 10000 bytes over the T1 from a system on the internal network. Those 10000 bytes can be sent to the router at 1 Gbit/s. The router will buffer all 10000 bytes and will send the data at 1.54 Mbit/s on the T1. As you capture on the 1 Gbit/s interface, you will see the data being sent at 1 Gbit/s, even though on the T1 it is sent at 1.54 Mbit/s.
Of course you can not send data to the router at 1 Gbit/s for a long period, as the buffers will fill up and packets will be dropped. The TCP protocol has mechanisms built in to prevent that from happening by adjusting the rate at which data is sent. But still in small intervals there will be higher bandwidths visible.