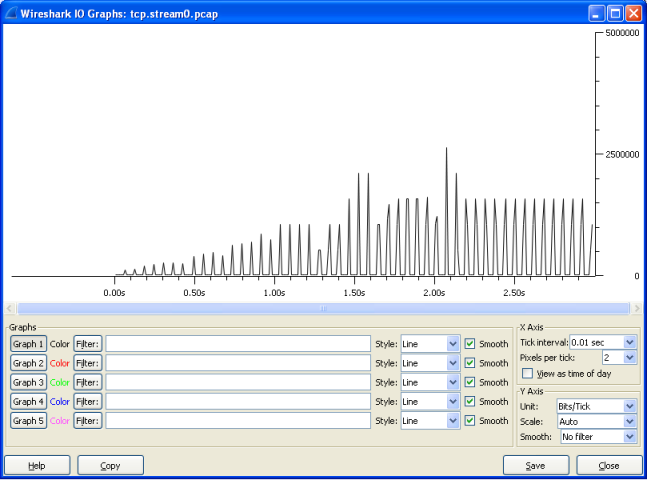
Hi Currently having serious asymmetric TCP performance issues between 2 Data Centers over ISP links (10Gbps IP transit into each). From site A (62.115.34.157) to site B (136.179.4.106) performance is good - 350-400Mbps over TCP. However from site B to site A performance is only 10% of this.. 35-40Mbps in general. Serious problem! Using iperf to test throughput in each direction. Note that UDP is fine in each direction - no packet loss and high throughput in both directions... pcacp attached is for iperf from site B -> site A. Lots of out of order and dup ack packets. Can anyone share some thoughts on this? asked 06 Oct '13, 14:21 c0lly wikified 06 Oct '13, 14:24 |
2 Answers:
First of all, it looks like the capture was taken directly on the node with the IP address 136.179.4.106, which is something you should not do when doing performance tests. Always use a third analyzer PC that captures the data, because
Other than that, it looks like the sender often has to wait for the ACK to come back when it has sent almost the full window size of bytes. It never seems to actually fill the window completely so there is no "Window Full" diagnosis coming from the Wireshark expert, but e.g. in frame 10 you can see that there are 13056 bytes in flight (receive window of 14720), and the ACK comes back in frame 11 after 60ms (which is the RTT). So the sender has to pause and wait, and that happens over and over again in the trace. The result is a rapid drop in the overall throughput rate. But, actually, it may be totally different, because of the way you captured. From what the TCP handshake tells us, the maximum segment size is 1470 for both nodes. So instead of the huge packets you captured in your trace there should be a lot of smaller packets, which may fill up the time span to the ACK (which I doubt, but you never know with a trace like this). So my advice here is to get your capture setup straight and do the test again. Otherwise the analysis is mostly guesswork. answered 06 Oct '13, 15:07 Jasper ♦♦ edited 06 Oct '13, 16:38 |
I had a very similar case recently. 100 Mbit/s (virtual) ethernet link full-duplex from germany to bulgaria. Same behavior as with your link (even the RTT was similar).
Hm.... The ISP swore their link is O.K. as they (presumably) ran all sorts of tests. I had to prove the link was not O.K. ;-) That was rather hard as they insisted that our testing methodology was causing the problem (well, sure who else could be the problem, except the customer). But finally they had to accept the results, as they could not show a real problem with the tests and we had the proof in the capture files :-)) The IO Graph and the other graphs (TCP Time-Sequence-Graph) shows an odd traffic pattern in your capture file.
One of your problems could be those 60ms delay from time to time (@Jasper mentioned that already) which kills your throughput. Then there is also packet loss. Now, if you compare the IO Graphs (and the other graphs) of both cases, do you see those repeating 60ms delays pattern in both directions? I guess no. Regarding the big frames @Jasper mentioned. They are clearly caused by TCP offloading in the NIC driver. Did you see the same (large frames) in the other direction? If no, you should consider that as a possible problem as well. However if you need hard prove for the ISP, you should follow the advice of @Jasper, otherwise they will tell you that something is wrong with your test setup ;-)) BTW: Regarding ISPs and 'ethernet' links over a WAN. One general problem seems to be over-provisioning (at least that's what I believe), meaning they sell more bandwidth to the customer base than they really have, although they guarantee the full bandwidth of the 'ethernet' link all the time via SLAs. So, in most of the cases everything works well. But if they hit the real ('physical') bandwidth limit (Example: 10 10Gbit/s users really demand their 10 Gbit/s, but there is only a 40Gig link), they start playing tricks by tapping into TCP connections with traffic shapers and/or WAN accelerators in the hope that customers don't figure out what's going on. After all, it's easy so say: We are clear. It must be your application or your network equipment. Sounds kind of 'mean', but I have seen this too often to believe anything ISPs tell me regarding that matter :-) Regards answered 07 Oct '13, 15:52 Kurt Knochner ♦ edited 07 Oct '13, 16:09 |


Where exactly is that PCAP?
Heres the pcap. http://www.cloudshark.org/captures/c2c22bdb3ee7
This is just the first few seconds of the iperf testing..
can you please post the first few seconds of the "good" sample?
Although with 300-400 Mbit/s that will be a HUGE file... so, maybe not a good idea ;-))