
Hi all, I've been experiencing the very strange issue. I collect the traces for SIP calls and then review them on my PC. Typically, I click Flow and review the graph. For whatever reason, since about couple days ago, I don't see any RTP streams in the graph. Only SIP messages are there. Also, some of the streaming IP addresses are not displayed in the graph. If I take this trace file to my co-worker's computer, I can see the graph completely including SIP and RTP. So, obviously there are some settings in my Wireshark instance that prevent viewing the graph in full but what they are? Yesterday, I re-installed Wireshark but it did not resolve the issue. Please, help to configure Wireshark. P.S. The 3 checkboxes at Edit->Preferences->Protocol->RTP are all checked. asked 27 Feb '14, 09:02 c_config |
One Answer:
Did you disable the RTP dissector
or set any 'Decode as' entries?
If there are any 'suspicious' entries, try to delete them. As a last option, print all your settings and compare them with the settings of another, working, system.
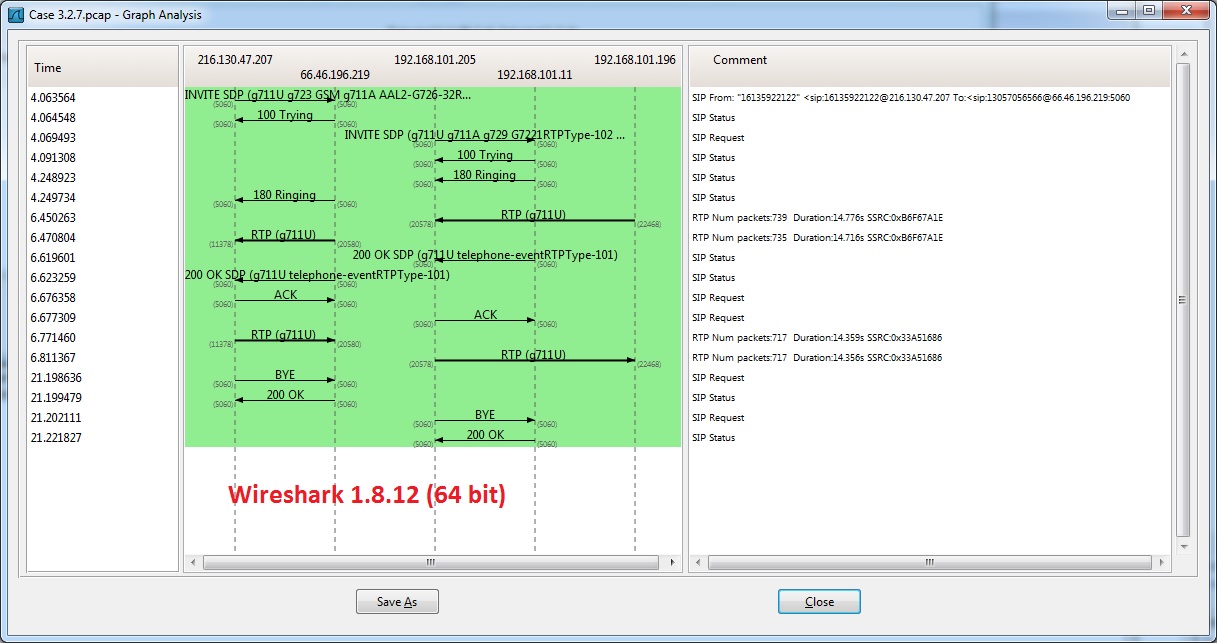
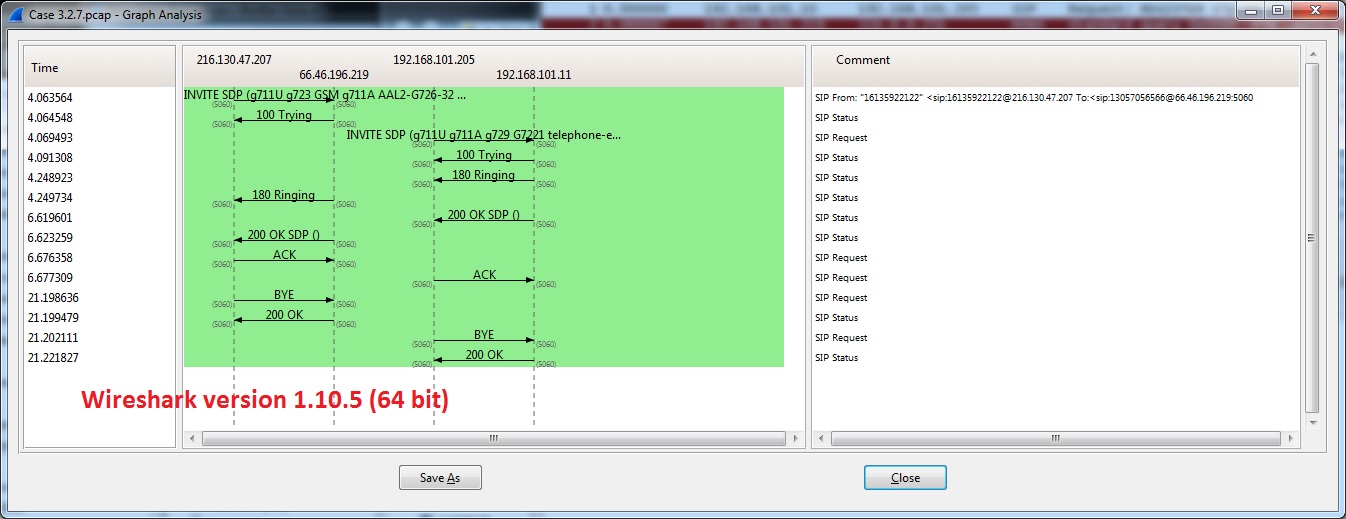
Regards answered 28 Feb '14, 07:07 Kurt Knochner ♦ And make sure 'Preference->Protocols->SDP->Establish Media Conversation' is checked. (28 Feb '14, 08:38) Hadriel Kurt, Thank you for the ideas. I've checked the those settings you mentioned and did not find difference if I change them. Then, I've started comparing the Wireshark' settings at my PC and my colleague's PC. Eventually, I found out my colleague' Wireshark version is 1.8.12 and mine is 1.10.5. So, I downgraded my Wireshark to 1.8.12 and here you go - my graph started working normally. Please, see 2 screenshots. This is the same pcap file opened on the same computer with the default settings in Wireshark. See the difference (like no SDP details, no RTP streams, IP 192.168.101.196 was not included).
(28 Feb '14, 12:37) c_config That's exactly what it would look like if 'Edit->Preference->Protocols->SDP->Establish Media Conversation' were un-checked. Please verify it is checked/enabled. (28 Feb '14, 12:54) Hadriel OK. I've re-installed 1.10.5 back and checked. By default, "Establish Media Conversation" was checked and I ensured it is checked now. However, the graph is incomplete. So, there is something else. (28 Feb '14, 13:14) c_config Is there any way you can post your capture file, for example to cloudshark or someplace public? Or if you can't, then taking a screenshot of the SDP payload protocol details in the INVITE and 200 response and posting them here? The graph shows fine for SIP+RTP captures I have, in wireshark 1.10.5. Maybe there's something odd in the SDP that prevents it from figuring out the RTP conversation. (do the packets display as RTP packets in the normal display window?) (28 Feb '14, 13:28) Hadriel I have posted the trace file at: https://www.cloudshark.org/captures/7a86b0a05538 From the beginning, I also assumed that there is something odd in SDP (like SRTP) is enabled. But why the older Wireshark can still display the graph? (03 Mar '14, 06:52) c_config Thanks for that - makes things much easier. :) It looks like you're right, there's a bug here somewhere. It works fine in 1.8.12, but not in 1.10.5 nor in 1.11.3. The SDP dissector or conversation tracker is getting screwed up somehow. The SDP itself is a little unusual for one call-leg half (there are two call legs in this, going through a Mitel SBC it appears), but not invalid; and even when I split the two call-legs into two separate capture files it's not tracking the RTP correctly. The number of codecs offered, the wide disparity in the UDP port numbers, and the video stream being rejected in the 200 ok are all "unusual" things too, but I don't know if any of them contribute to the problem. Would you like the "honor" of creating a bugzilla entry, or would you rather someone else do it? (03 Mar '14, 10:18) Hadriel I am sure you can do this better (in terms of issue description). So, I would let you to submit a bug. It is strange though that version 1.10.5 was working fine for few weeks since I installed it and then got corrupted. I suspect that some of those overnight Windows' upgrades could contribute to this. Meanwhile, I am going to install the older version 1.8.12. Thank you very much for your time and support! (04 Mar '14, 12:08) c_config Bug 9835 submitted. Do you know approximately when it stopped working? I can check the code submissions since then to see what's changed. (04 Mar '14, 13:12) Hadriel I believe it stopped displaying RTP properly on around 24-26 February. (04 Mar '14, 14:00) c_config showing 5 of 10 show 5 more comments |
What version of wireshark are you running, on what platform?
The Wireshark version is 1.10.5 (64 bit) and OS - Windows 7.