
We have a source server 10.235.3.53(local) transferring to 10.240.44.9(remote), and throughput is quite slow. All local links/devices have been vetted as clean so we moved to a capture. I see a lot of DUP ACKs followed by retransmits, which would be why we're seeing reduced performance. https://www.cloudshark.org/captures/00208d87b26d This particular capture is the inside interface of the local firewall. The dup ack I see are sourced from remote 10.240.44.9 to the local 10.235.3.53, so it would appear the packet is getting lost somewhere between our local firewall and local server. Then we see 10.235.2.53 do a fast retransmit since it never saw an ACK for the packet. Correct? Is there anything I'm missing from the capture which can give more details? Thanks all! asked 14 Oct '14, 14:16 parsonsproject edited 14 Oct '14, 14:23 |
2 Answers:
Packets are being lost between your capture point and the receiver, 10.240.44.9, not between your capture point and the sender. To verify this, select any of the six packets that Wireshark has identified as retransmissions. Open the TCP portion of the packet, right-click on the sequence number, and select "Apply as filter > Selected." You will see both the original packet and the retransmission, meaning that the original packet made it from the sender to your capture point; it was dropped somewhere downstream from your capture point. No, the Fast Retransmissions are not because the sender never got an ACK for the data packet. Fast Retransmissions are triggered when the sender gets three Duplicate ACKs from the receiver. When a packet is transmitted, the sender starts the Receive Time Out (RTO) timer. If the RTO timer counts down to zero and no ACK has been received for that packet, the sender will retransmit it. However, the sender will also retransmit the packet if it received three Duplicate ACKs from the receiver, and this happens more quickly than the RTO timer counts down, hence the name "Fast Retransmission." This communication was already underway when the capture started, so the TCP three-way handshake is missing. Whenever possible, try to start capturing before the TCP connection is established so that the three-way handshake will be in the capture file. There are certain things that are only seen in the three-way handshake. For example, it is very likely that window scaling is usesd on this connection, but without the handshake, we don't know what the window scaling factors are so we don't know what the true TCP window sizes are. answered 14 Oct '14, 16:05 Jim Aragon edited 15 Oct '14, 05:03 Thank you Jim that is helpful. I'll have to get another capture for the 3-way handshake, but I do have the traffic capture on the local firewall outside interface and the far firewall outside interface captured as well local firewall outside interface https://www.cloudshark.org/captures/c99c0a9518e2 remote firewall outside interface https://www.cloudshark.org/captures/fae08e88b12f remote firewall inside interface https://www.cloudshark.org/captures/ccfa5d77927f Setting up the filter as you mentioned, I see the original encrypted packet go out the local fw outside interface, as well as the tcp fast retransmission packet, however on the far side we don't see the original packet get to the outside interface, just the follow-up re-transmit. So the drop is occurring somewhere between the firewalls then? Is there an easy way to follow tcp streams through interfaces? I'm having troubles aligning which packets on the inside capture correspond to which packets on the outside capture. Thanks again (15 Oct '14, 07:13) parsonsproject Yes, the packets are being dropped between the two firewalls. To correlate the two streams on different sides of the firewall, you need to look for some common value in each stream. You could try IP ID and/or TCP sequence numbers. (16 Oct '14, 05:02) Jim Aragon |
After looking at the traces in the Juniper I must correct my statement.
https://www.cloudshark.org/captures/a43693daae83 https://www.cloudshark.org/captures/cce154b812a1 Regards Matthias answered 14 Oct '14, 22:34 mrEEde edited 16 Oct '14, 04:17 Thanks for the feedback Matthias, I have to dig into that a bit more. So the diagram above is the dst, so we are looking at timestamp values on return packets from the dst to the source? Just to note the 10.235 source is in a different state than the 10.240. I also see tsval increases from the local src ranging from 1ms up to ~30ms and higher... 25 2014-10-14 11:50:44.926938 10.235.3.53 203509526 10.240.44.9 SSH 1438 Client: Encrypted packet (len=1368) 27 2014-10-14 11:50:44.955379 10.235.3.53 203509555 10.240.44.9 SSH 1438 Client: Encrypted packet (len=1368) Are we saying that the src sending machine simply isn't sending the data quick enough? Thanks, this is great discussion for me! (15 Oct '14, 07:45) parsonsproject I'm trying to say that from the capture point's view the receiving node at 10.204.44.9 is not sending ACKs quickly enough, (15 Oct '14, 07:51) mrEEde What are you using for the tcp delta and RTT, in your custom column? (15 Oct '14, 09:37) parsonsproject tcp.time_delta and tcp.analysis.ack_rtt are the two custom fields. (15 Oct '14, 12:14) mrEEde I am refering to w-o.pcap(https://www.cloudshark.org/captures/c99c0a9518e2),Source 10.235.3.53 sends 6 packets between 9-16 packet and received ack for each of them,slow start rule says we can increase our CWND by one MSS for each ack we received,if we follow this rule in next bunch source 10.235.3.53 should had sent the 12 packets but unfortunately it didn't.In next bunch source send only 7 packet 20-29.This pattern repeats itself.is it tcp or openssh application,who is restricting this ? I was looking at Hansang 2013 sharkfest presentation on slow ssh file transfer and there it was a problem with openssh application setting channel_session_windows_default. (18 Oct '14, 07:08) kishan pandey |
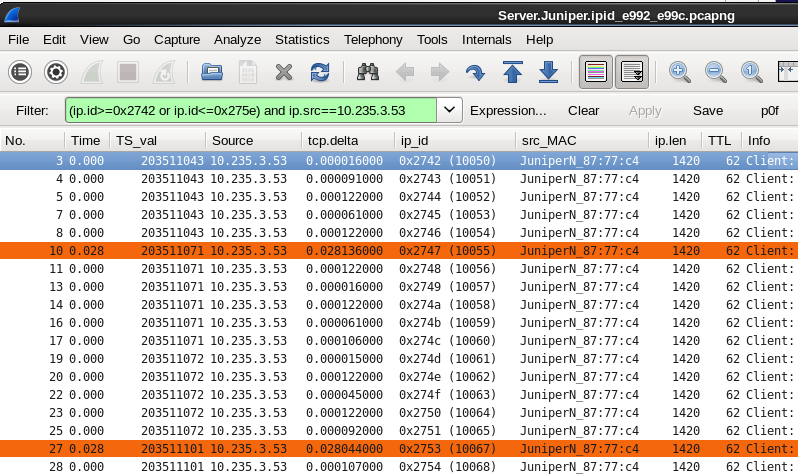 I reduced the files based on ip_ids and uploaded an example here:
Here is a capture of the 3 way handshake https://www.cloudshark.org/captures/55bd973d2a44
If i read this correct, initial window size from src is 5840, and slowly scales up to 10880. The dst has a window size which scales to 69632. So they are not settling on a nice window between the two? I see line 365 a tcp window update from the far end to the local src, but it doesn't seem to do anything with the sender's window.