
According to the Howto here I can just open the Wireshark.exe and debug it in VisualStudio, asked 15 Oct '14, 07:38 lal12 edited 15 Oct '14, 08:54 grahamb ♦ |
One Answer:
Works for me with VS 2013 Pro
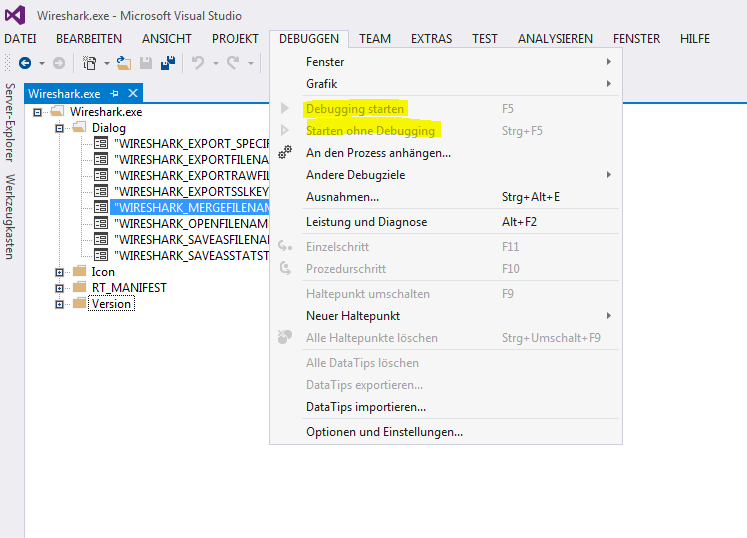
answered 15 Oct '14, 09:00 grahamb ♦ Well, it does not work for me. I also have VS 2013 Pro installed, but when I open the file the only available option in the debug menu is "An den Prozess anhängen" (~"concat on the process", probably wrong translated).
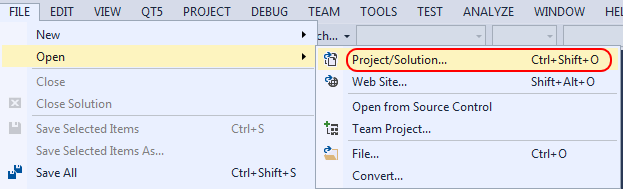
(16 Oct '14, 00:05) lal12 You haven't followed the instructions properly, you have opened Wireshark.exe as a "File", e.g. the following menu op; File | Open | File, or "Ctrl + O", probably not helped by my instructions being in English and your VS running in German. Reread the instructions above or use the "Ctrl + Shift + O" shortcut. (16 Oct '14, 03:55) grahamb ♦ 1 An image of the required operation:
(16 Oct '14, 03:57) grahamb ♦ Ok thx, I found that by myself after a while. But removing the O2 flag helped. (16 Oct '14, 04:31) lal12 Actually debugging optimised code is a separate question I think. If an answer has solved your issue, please accept the answer for the benefit of other users by clicking the checkmark icon next to the answer. Please read the FAQ for more information. (16 Oct '14, 04:38) grahamb ♦ |
Now I found a way:
But some bugs seems to occure:
- If you set an breakpoint to an "if" or "switch" you cannot see the value of compared variables, also this is not possible in the if/switch block itself. But it works if you set the breakpoint at least one step before the if or switch command.
- I am note sure, but I think sometimes the "Einzelschritt" (~"go one step") does not work, it seems that it jumps several steps.
Ensure to compile Wireshark without optimization. Edit config.nmake and remove the /O2 flag from LOCAL_CFLAGS. Then clean the objects and recompile.