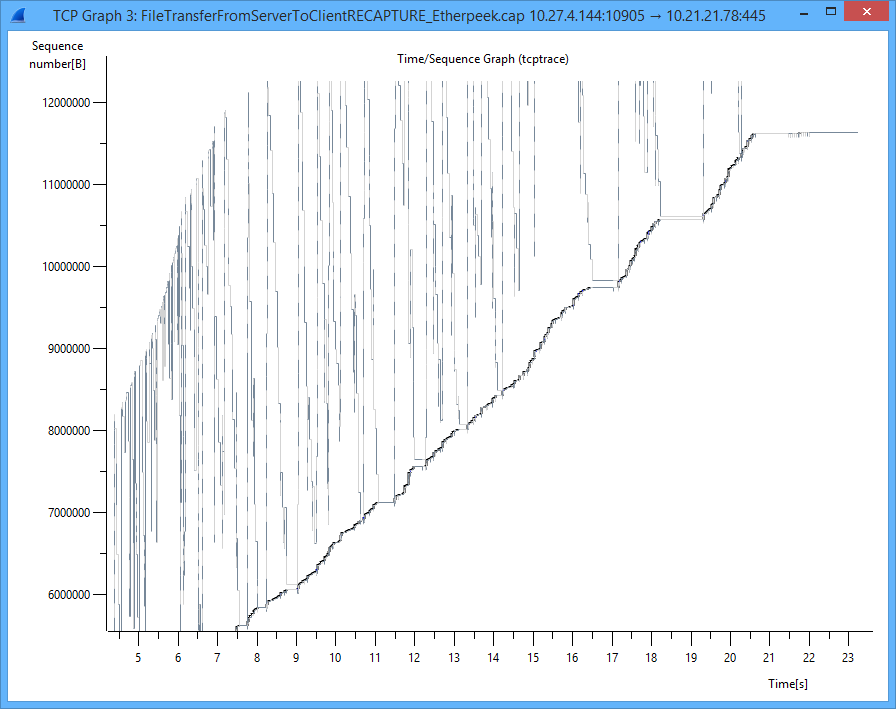
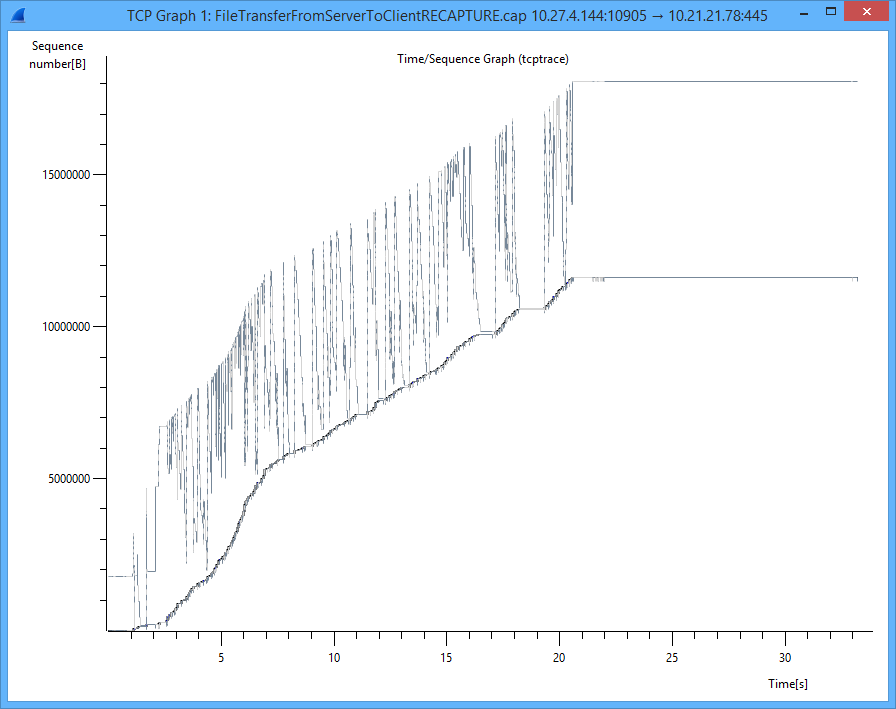
I'm got a capture with what seems like some very poor tcp performance. the general stats are listed below. The throughput graphs is pretty strange and I'm hoping for some explanation. Total Frames: 9655 TCP Duplicate ACKs: 1356 - 14% TCP Retransmissions: 167 - 1.7% TCP Out-of-Order - 373 - 3.9% TCP Zero Window Segment - 2 (Client) Packets A-->B: 3975 Bytes A-->B: 12503695 Bits/s A-->B: 3,012,201 Duration: 33.2081
asked 09 Aug '15, 16:47 fritzbied |
One Answer:
Not sure exactly what the question here is but ... The 'strange-ness' of the graph is due to TCP segmentation offload being enabled Regards Matthias answered 10 Aug '15, 23:20 mrEEde |


Interesting....tcp segmentation offloading, will have to look into it. The captured was taken with NETMON on a Windows 2008 server and analyzed on a Windows 8.1. I was trying to understand the TCP ack behavior based on the graph.
If the graph is not impacted by TCP segmentation offloading can you explain the ack line jumping up and down with reference to the segment throughput line? First time I have seen something like this on our network. Or am I totally missing the point on this?
Thanks in advance
Fritzbied
hard to tell without the pcap file. Would it be possible to upload the capture file somewhere and post the link here for further analysis?
I believe its the seq numbers that are 'jumping up and down' due to retransmissions ... and the ack numbers are increasing pretty steadily ...
Without the pcap it's hard to tell though
hm.. the time/sequence graph usually only shows data in one direction, which would mean that either the SEQ or the ACK numbers are really 'jumping' (no idea what would cause that) OR that there is a bug in Wireshark. We would need the pcap file to figure out what's going on.