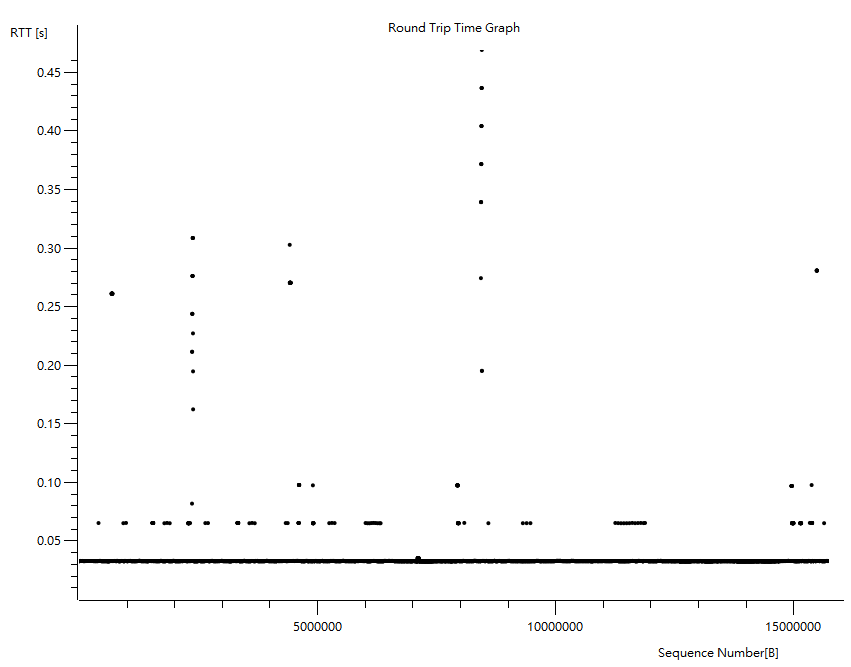
Hi everybody, I am trying to figure out how to find the most common RTT for a packets from sender and receiver and back. From what I observed from the RTT graph (Statistics | TCP StreamGraph | RTT graph), there is a horizontal straight line in the bottom of the graph, so is that the one called "the most common RTT" ? Also I am not sure why some of the packet will have a much higher RTT value in a specific sequence number, what would cause this happen ? Updated: Just realized that those who have higher RTT value packets (outside the horizontal straight line) are all have a [ACK] flag...why a packets with a [ACK] flag would have a higher RTT ? Thank you! Here's the RTT graph of the trace file: asked 22 Sep '15, 18:57 phantomcy edited 22 Sep '15, 19:12 |
This is a static archive of our old Q&A Site.
Please post any new questions and answers at ask.wireshark.org.


can you upload a sample capture file somewhere and post the link here? If the file contains sensitive information, please use TraceWrangler (tracewrangler.com) to anonymize it.