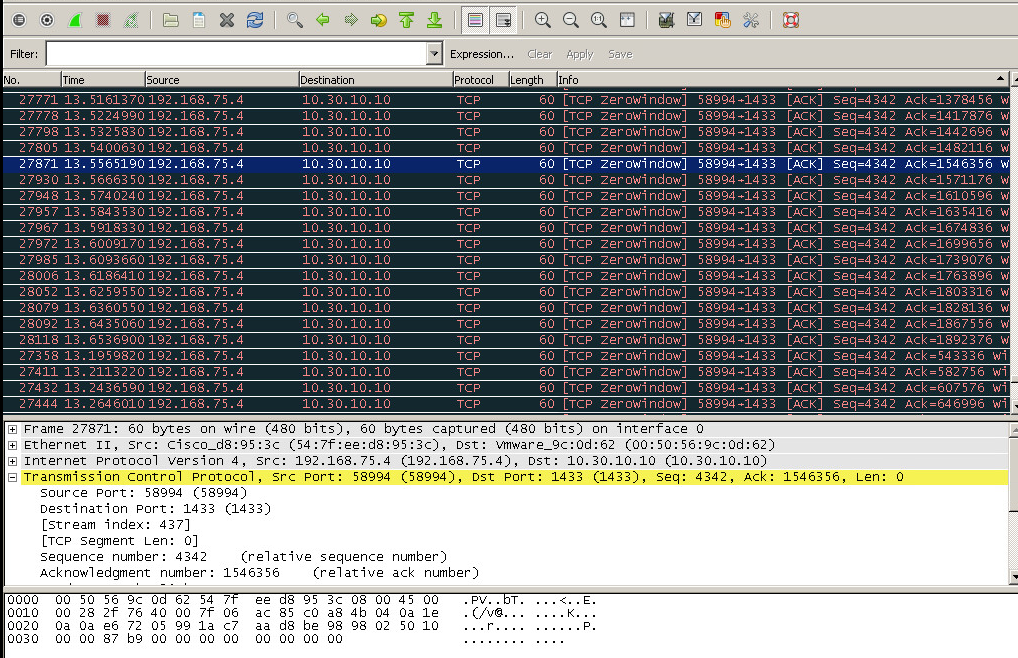
Greetings, I work for a medium sized healthcare institute of about 700 employees. We run an EMR (Electronic Medical Records) system that is responsible for just about everything we do. It consists of two servers, one 2008 R2 Application Server and one 2008 R2 MS SQL Server. For a good while now we have had several complaints of random slowness or lockups within the application which results in angry physicians and nurses and ultimately slows down the company as a whole by increasing visit times due to a slow system. To the end use this issue looks like a drop in network connectivity but I have been able to debunk this by checking switch logs, event viewer logs, and other various traps and monitors I have setup throughout the network. The servers themselves appear to be generally OK but that is not exactly my area. But working with the systems administrators we feel that the issue is more or less with our SQL server. I used Wireshark to take a capture of the traffic going across it but I'm really not well versed in Wireshark enough to understand fully what I am looking at. One thing does stand out is a bunch of the following...
The destination 10.30.10.10 being our SQL database server and the source 192.168.75.4 is one of our terminal servers. I've researched a little on TCP zerowindow but I don't fully understand it or how to go about resolving it. I would appreciate any help anyone could give. Thank you, -Adam asked 16 Oct '15, 11:48 Adam Barnett |
One Answer:
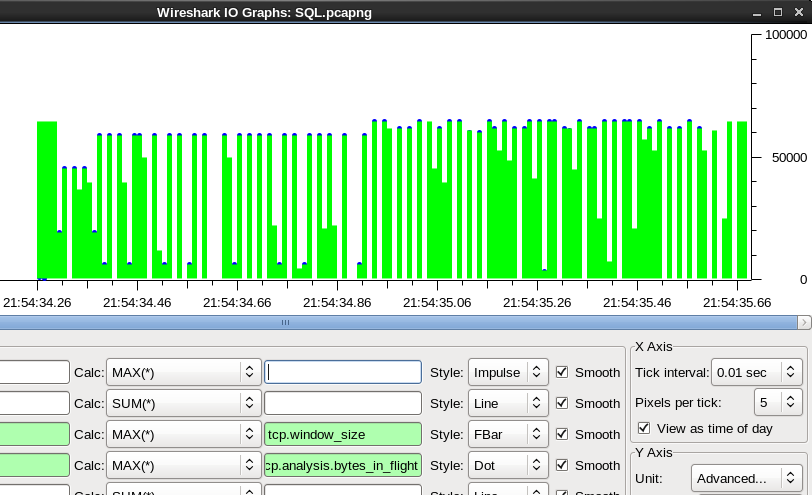
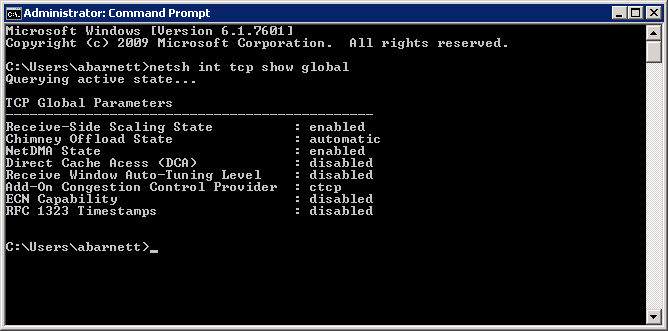
Your terminal server is not offering TCP window scaling therefore the offered TCP window-size cannot exceed 64k. Setting this seems to have no effect, since auto-tuning uses the TCP 1323 scale factor and changes it on the fly, disregarding this setting. Additional testing may be required to determine it’s effect if auto-tuning is turned off. Setting it to 1 is best for broadband connections.
answered 16 Oct ‘15, 23:02 mrEEde @mrEEde: Do you have another nice link about this auto tuning behavior? (16 Oct ‘15, 23:54) Christian_R So I’d say you need to enable Auto-Tuning. https://support.microsoft.com/en-us/kb/947239 (19 Oct ‘15, 09:28) mrEEde Receive Window Auto-Tuning is set to normal on the SQL server and disabled on the terminal servers. I will run this by the server folks first before I set it. (19 Oct ‘15, 12:46) Adam Barnett |


Could you provide us a trace?
Here is an example of what I see.
https://www.cloudshark.org/captures/18b46be08aac
That are really large segments above 50k and greater (TCP Offload enabled). I don´t think that is the cause of your prob, but it makes it even harder to say something reliable.
From my point of view it would be better to take a trace at the 10.30.19.113. Because there is the prob and you can hopefully (RSC disbaled) see the segemnts like they are on the wire...