I have a S2S VPN connection between 2 sites on different continents. I used to get excellent transfer rates until about a week ago when it all started spiking all over the place. I'm rather new to Wireshark so please bare with me. I understand the meaning of the Retransmissions but what I dont get is when it retransmits in "Continuation to #679" about a million times. Also what does it say when all the ACKs are in this context "Continuation to #679"? pcap attached, thanks https://www.dropbox.com/s/njm72lks6p2xvo0/smb1.pcapng?dl=0 asked 13 Dec '15, 07:06 xcalibur |
2 Answers:
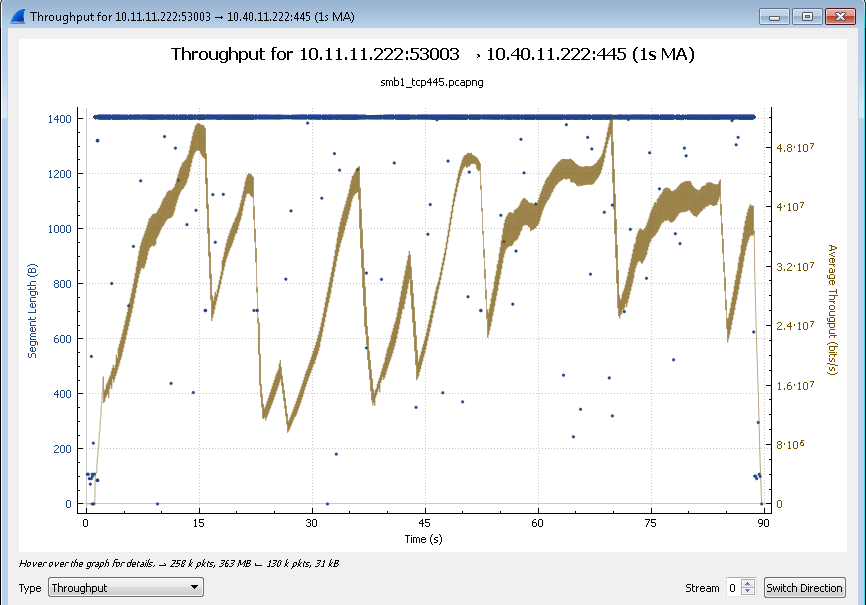
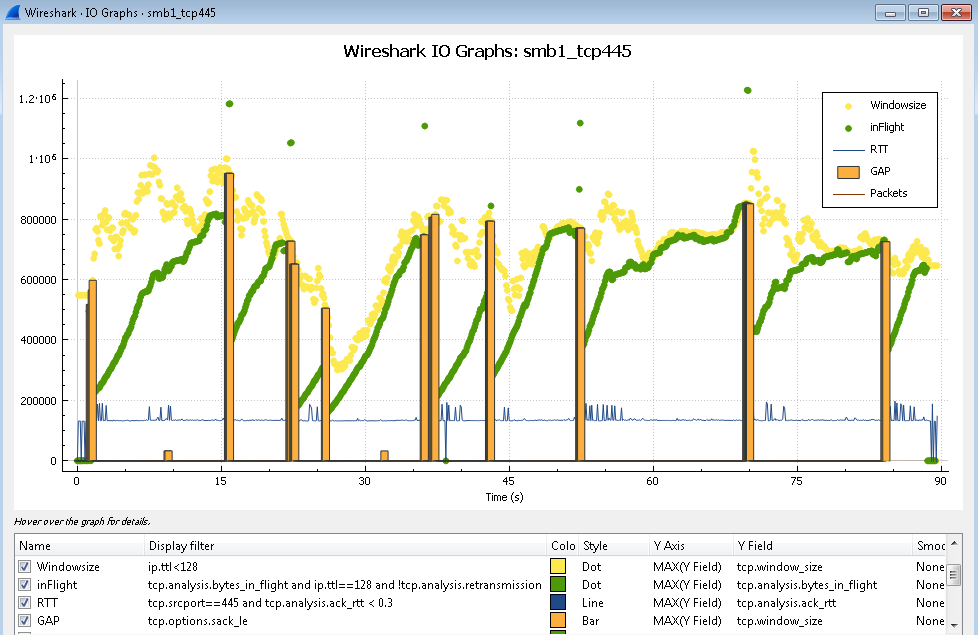
The 'poor' performance is caused by packet loss. The Bandwidth Delay Product BDP determines how fast your SMB write can be. In the graph below you can see the number of bytes_in_flight dropping after SACKs were received indicating a GAP was detected at the receiver. So - as Sindy pointed out - a 0% packet loss rate in pings doesn't really tell much about the packet loss on your TCP session. When this all started to get slow a week ago, something in your network must have changed answered 14 Dec '15, 04:30 mrEEde edited 16 Dec '15, 07:37 |
Not sure I understand exactly what you mean by "Continuation to #679", because I cannot see anything like that in your capture. Can you give the order number (the leftmost column of the packet list pane) of a frame (packet) in the capture where you can see this "Continuation to #679"? But leaving that aside, I'd say that the root cause of your transmission slowdown is very simple: high packet loss causes frequent need for retransmissions, and the path delay causes the negotiation of these retransmissions to slow down the resulting transmission speed (because it takes long for the sender to learn that a retransmission is necessary). As the path delay is really high at an inter-continental link, the resulting slowdown is really high too. Now why you can see "a million times the same ack number" is because Wireshark's tcp analysis and default coloring rules take care only about ack numbers and ignore the SACK values. So if you take a closer look at those packets with the same ack number (which is the reason why Wireshark marks the packet with black background and "Dup ACK" text), you'll see that while their ack number stands still, indicating to the sender the position in the session data after which the loss began, the SLE and SRE values keep changing, telling the sender which parts of the session data after the lost part(s) have been received, i.e. that those data need not be retransmitted. See more about how SACK works in this illustrative blog post. Another point is that the calculation of relative seq numbers is not synchronised between the two directions of the session because the tcp session establishment is missing in the capture. So to be able to match seq and ack between directions properly, you have to switch over to absolute seq values, which are far less comfortable to read but the only real ones. When you do so, you can see that: the last packet which has been delivered successfully is in frame 864, with relative (to the beginning of the capture) time 7.05 seconds. The one which has been lost follows it almost immediately, in 18 μs. Now the first packet informing about the loss (in frame 1299) has arrived some 160 ms later. So the missing packet is retransmitted in frame 1305 (relative time 7.217205), but it takes until relative time 7.350896 (i.e., another about 130 ms) that its reception is confirmed. In the meantime you can therefore observe those "million acks" coming at a rate of several packets per millisecond. But it is still not the end of the story because even the packet confirming reception of the one in frame 1305 contains SLE and SRE, meaning that the receiving side still has gaps in what has been received. When you apply a display filter answered 13 Dec '15, 10:53 sindy Thanks for the educated reply! Here's a sample of the "Continuation" I had mentioned earlier: Latency is the first thing I thought about. I get a very constant 130ms connection but it's VERY steady. Out of 3827 packets transmitted I got 0%(!) packet loss. How does this make any sense? (13 Dec '15, 13:17) xcalibur OK, as for the [Continuation to #xxx], let's agree that you are probably using a different version of Wireshark than me, because for the same packet, my Info column in the packet list doesn't show that. As for your "VERY steady" connection - are you saying that you were sending pings for more than an hour, one per second, and none got lost? If yes, please think about the packet rate and the amount of the data:
Your trace illustrates more than clearly that the packet loss happens. If you need a stronger proof, take the capture simultaneously at both ends, and compare the two captures. The latency would be harmless without the packet loss. (13 Dec '15, 13:59) sindy Not every second. It's "ping -A" in Linux. It's much faster. --- 10.11.11.222 ping statistics --- 10000 packets transmitted, 9996 received, 0% packet loss, time 1310345ms rtt min/avg/max/mdev = 130.643/130.917/145.566/0.404 ms, pipe 2, ipg/ewma 131.04 7/130.884 ms But I suppose those packets are indeed small as you claim. How big would you recommend me to send them? Appreciate the help! (13 Dec '15, 15:04) xcalibur
should have drawn your attention to the fact that the linux ping cannot handle fractions of percent, so any loss ratio below 0.5 % (or 0.1 % at best) is displayed as zero. I assume you've limited the number of packets beforehand using -c (because otherwise you are a cyborg to hit ^C exactly after 10000 packets sent), so the ping had its time to wait for responses to the last requests sent, and still 4 pings have not been responded. So bearing this in mind,
doesn't say more than "Out of 3827 packets transmitted, not more than 19 packets got lost" without the "3827 transmitted, 3827 received". To simulate the channel load coming from the tcp transmission using ping, you would need to use both
Or simply stop playing with ping and start believing what Wireshark is telling you :-) (14 Dec '15, 02:01) sindy |

 Assuming the Window-Scaling factor from the SMB Server was 64 it can be seen that it is not the window_size offered by the receiver that is slowing you down but the congestion window at the sender caused by packet loss and required re-transmissions.

@mrEEde
Any chance of expanding the image of your second graph to show all the graph setup fields as this is an interesting setup?