I'm troubleshooting a slow performing application which is developed by a third party. Info:
q
q
q
I am looking for assistance in ruling in (or out) the network and any other pointers if visible from these traces Thank you asked 13 May '16, 08:27 Brad_101 edited 16 May '16, 03:41 |
2 Answers:
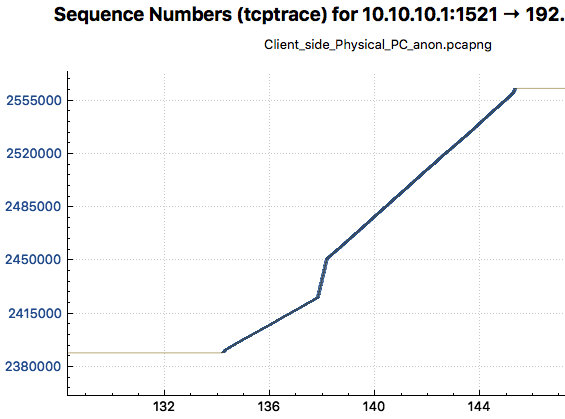
Well in the trace of the terminal server we can see test duration of 1.3s (Paket 1225 to 4399) and in the physical we can see a duration 11,2s (Paket 11250 to 14433) which is around 6 times more. We know that the Response time varies a little bit around 6 - 8 ms and of the terminal server, too. It could explain it from my point of view.
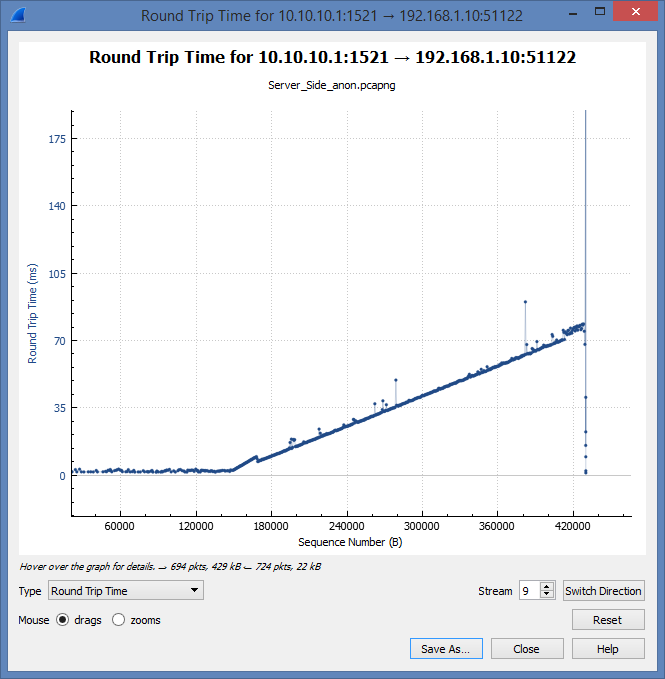
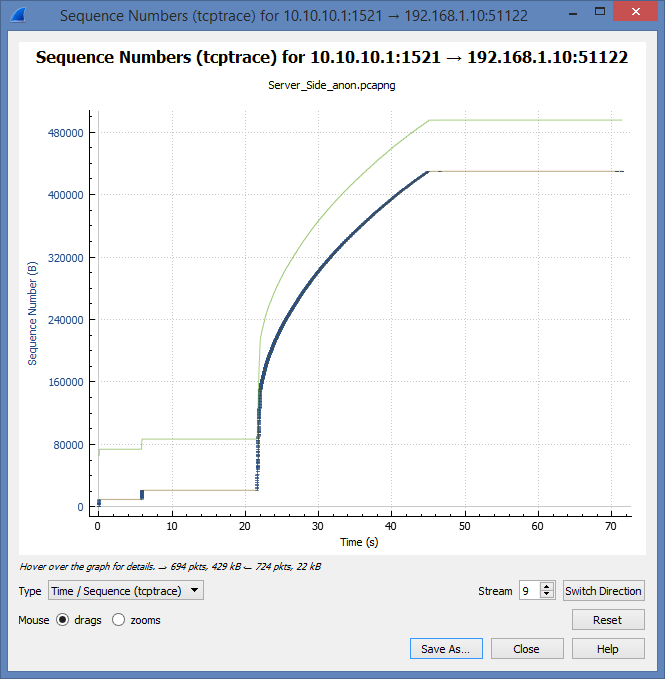
answered 13 May '16, 14:23 Christian_R So, do you mean the delay is due to WAN? (13 May '16, 14:29) Brad_101 Yes and 6-8ms round trip time is not so long for WAN from my point of view. The test scenario does not like this, by design. (13 May '16, 14:31) Christian_R Probably because the database query is badly written and requires say 1,250 request-response pairs to complete. 1,250 times 8 ms is 10s. On the LAN 1,250 times 0.8s is 1 second. (13 May '16, 15:11) PaulOfford It is exactly like Paul said. The database query is written so badly. (14 May '16, 12:21) Christian_R Why are the start & end times the same on client and server? Wouldn't we see a longer period of time at the client? (16 May '16, 09:17) Brad_101 @Brad_101 Your "answer" has been converted to a comment as that's how this site works. Please read the FAQ for more information. (16 May '16, 09:36) grahamb ♦ No. You will see more or less the same graph on both ends, because the client first sends a new request after he has received the response of the old request. (16 May '16, 09:47) Christian_R Ah ok, thanks What can you tell from these traces: Client = https://drive.google.com/file/d/0BxWWq7ozi-PFeGZrNlBUanpkOWs/view?usp=sharing Server = https://drive.google.com/file/d/0BxWWq7ozi-PFNHhHLV8yNXREbVE/view?usp=sharing Took 50 secs to load on client (16 May '16, 10:15) Brad_101 No. There is a gap of more than 30 sec in the trace, where no data flows. I guess it is application or user related. But can´t say more, because the app data is sanitized. I talk about frame 956 and 057 of the server trace for example. (16 May '16, 11:59) Christian_R I see that now, thanks Christian. That isn't user delay as I used that application during the capture & all that was done was run Wireshark, open app, wait for traffic to stop, open customer record, stop capture. With TCP streams, how do you tell / know if in my example of opening a customer record, that conversation is or isn't a single TCP conversation? (16 May '16, 12:24) Brad_101 I just guessed. But this looks like the one. Because it goes over 50s and looks a liitle bit like a download sessioon. But of course I am not sure, because the application data is missing. For 100% to be sure you always need the full socket pair. (16 May '16, 12:56) Christian_R Hopefully this is a better trace for you: https://drive.google.com/open?id=0BxWWq7ozi-PFek1lbzBFcFVYS0U (16 May '16, 13:25) Brad_101 Well this trace shows something new and something old. So could you please describe again in prosa the problem which we should see in the trace. Because I don´t want explain things that does not matter in this case, like the zero windows. (17 May '16, 11:56) Christian_R This capture has approx a approx 35sec user delay and then a record was searched which took approx 50 sec to load. The 50 delay is the problem (18 May '16, 04:50) Brad_101 Well as we cann see for StreamID==9 the RoundtripTime Grows during the session. Beware of, that we are now on the server side. The reason, if it is the network or the client can´t be reliable answered with this trace. But at least we can say it is not the server. (18 May '16, 11:53) Christian_R showing 5 of 15 show 10 more comments |
It's probably unfaiir to say it's badly written without seeing the code. However, it's fair to say that it's written in a way that is not optimized for use over a WAN. answered 16 May '16, 14:42 PaulOfford |


Do you mean with response time, the time the test need to run? On a physical client it takes 13s and on a Thin Client the test needs 6s to run?
BTW: My personal understanding of response time, is the time the application needs to response to the request.
That is correct. The time for the test to run and it seems to be physical client only
Well the thin clients are connected server. So if I understand it right the terminal server is located in the same location (Datacenter) like the Oracle?! So only the graphical output must be transfered over WAN, or am I wrong?
That is correct however I have been advised the same test has been conducted from a physical pc in another site (all three in a triangle) and the response time was good.
I haven't seen that for myself Though
In the trace we see for the terminal server <1ms network delay for the physical client we see up to 8ms delay between request and response at the client side.