Hello, Lately our users are complaining of our ERP system, saying it's super slow and they can't get work done. Our previous application developer says that it's most likely the network as he doesn't see anything unusual on the sql server. Our networking team thinks it's the application itself. I'm trying to build a case with hard facts to determine where this slowness is coming from (or if it's a case of one user complains, so they all complain). I ran a wireshark capture, and found that there are multiple times where there's a [RST, ACK] Connection reset warning. I'm trying to determine if this is anything of significance on my journey to finding this "slowness" issue, but have no wireshark experience. Do you know what a connection reset (RST) is and why it's happening? I haven't found much using google. Thanks. asked 23 May '16, 12:37 slownessissue edited 25 May '16, 11:33 showing 5 of 9 show 4 more comments |
One Answer:
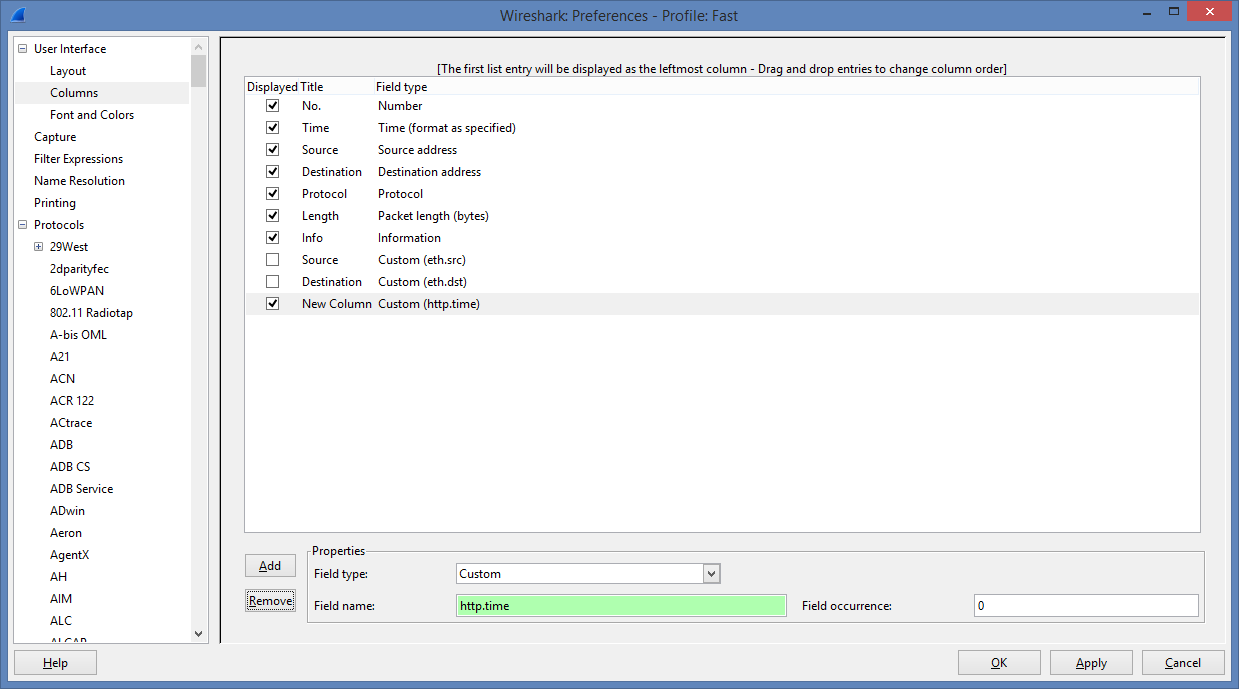
You should set the filter to: Then choose in the Edit -> Preferences dialog window under protocols the TCP protocol. There you should enable TCP reasembly in this case. Then choose in the same preferences dialog "User Interface" -> columns In that window you push the "Add" button and choose as Field type "Custom" As "Field name" you should use After that you can do a "Follow TCp Stream" at the frames with high http.time.
answered 25 May '16, 12:16 Christian_R |


It is much more a TCP question than a Wireshark question.
An RST flag in TCP normally indicates an emergency dropping of that TCP session. In addition to the session participants (the client and the server), the source of such packet may also be some security equipment (firewall) between them, e.g. due to recognition of a signature of some kind of attack in the session, which may happen even if the session is actually harmless. So the first thing to do would be to capture at both the client PC and the server to see whether those RST packets really come from one of them (so can be seen at both ends) or from some box in between them. Next, I would watch how much time had elapsed since the last packet of that session which went in the opposite direction before the RST packet was sent (as the application may have reset the session as it gave up waiting for some response from the other side).
Could you share us a trace on public accessible place, like cloudshark or Dropbox... If you worry about privacy, use TraceWrangler (https://www.tracewrangler.com) to randomize all IP addresses and remove the TCP payload (verify it looks good before uploading, "good" meaning IPs are different and the packets have no TCP payload anymore). Please make sure that you include the TCP handshake.
Christian_R,
Here are the captures. The IP's that you'll be wanting to look at are 192.168.1.131 and 192.168.1.130 (they're our SQL/app servers).
https://www.dropbox.com/s/hzysfvg2ozgxdtu/packet%20capture%20nsweetland.pcapng?dl=0
https://www.dropbox.com/s/8lp8emt90okdqfw/nick%20capture%202.pcapng?dl=0
Thanks.
On which port is the SQLite server listening or do you use http?
By using the steps here in method 1 (https://sqlandme.com/2013/05/01/sql-server-finding-tcp-port-number-sql-instance-is-listening-on/) I'm showing port 1433 as a statically configured listening port.
Can't see that port in the trace.
It's possible it may run over http still somehow, but I don't know enough about the application to determine this. After running a packet trace of someone logging into the desktop based application, I'm seeing a bunch of http/1.1 responses though.
I think the network looks very calm. Some http responses took long time.
Thanks for the feedback. Can you tell me which packets you saw that took a long time? I will note this down.
Thanks