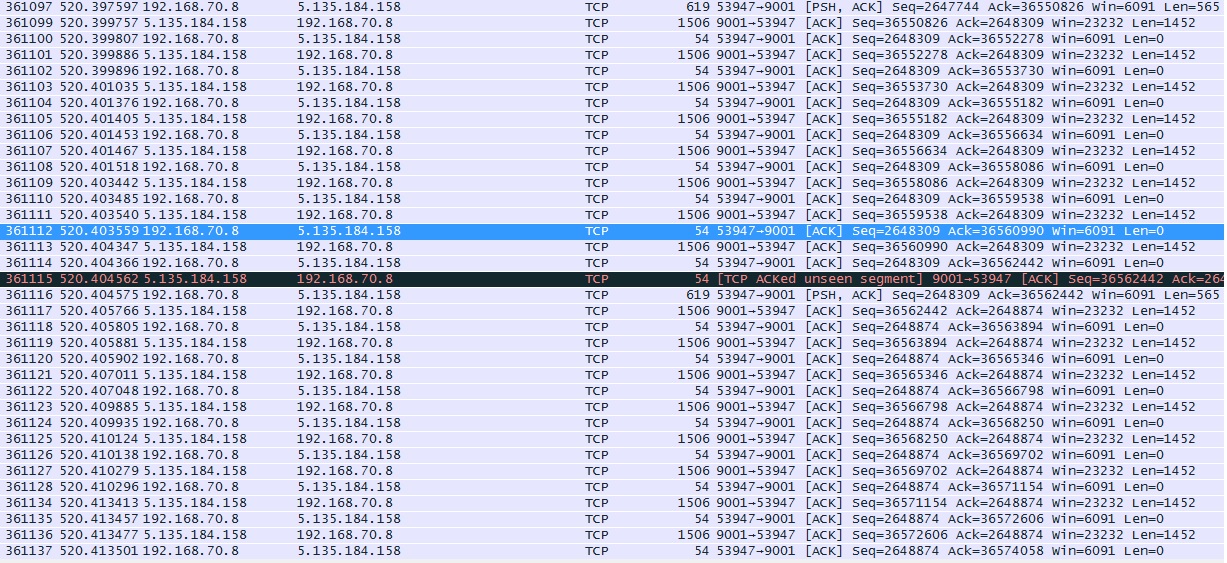
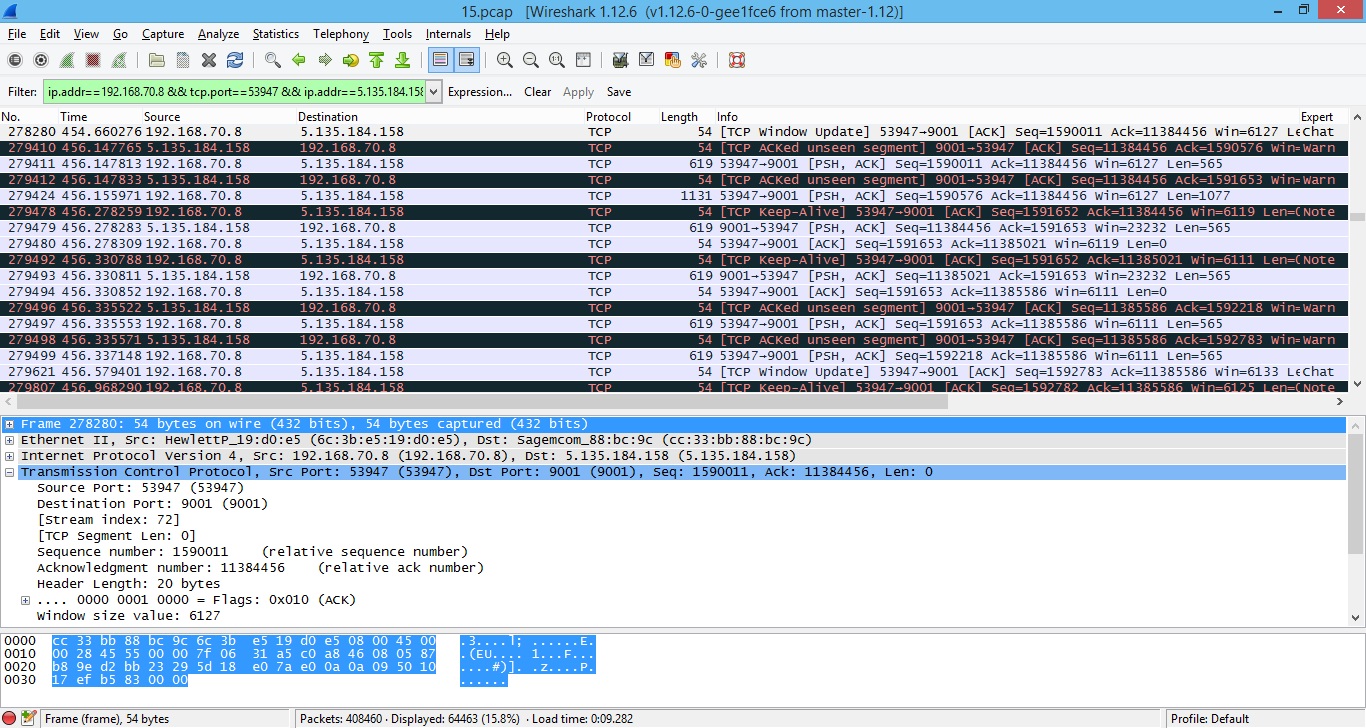
Hi all, is this showing that there was a DNS attack ? because DNS attack would be flood with SYN packets and not ACK packets
asked 02 Dec '16, 09:00 doran_lum edited 03 Dec '16, 00:22 |
One Answer:
No, this is not DNS attack. This looks like an ordinary unidirectional TCP data transfer. Why do you think DNS attack is "flood with SYN packets"? DNS flood attacks usually use UDP which has nothing to do with SYN flag concept. See the next article: https://www.incapsula.com/ddos/attack-glossary/dns-flood.html answered 02 Dec '16, 10:23 Packet_vlad showing 5 of 7 show 2 more comments |


Thank you. Does this means a high load of TCP data transfer which might have slow down the network ?
It's hard to tell just looking at the screenshot. An influence of this stream can vary from "almost none" to "heavy". It depends on many factors:
1) How often it happens (once, every 5 min, intermittently);
2) For how long time it lasts (2 seconds, 10 minutes, constantly);
3) What's you available bandwith.
Now I can do some calculations from your screenshot (roughly): used bandwith = received data / (end time - start time) = (1506*16 + 1506(unseen) + 619) / (520.413477 - 520.397597) = 26221 Bytes / 0.01588 sec = 1651196 Bytes/sec ~ 13 Mbit/sec.
But again, I don't know how long did it last. Maybe, that's absolutely not a problem.
To get full unferstanding you first need to formalize you complaint like the next: web-access is slow 1-2 times a day for 10-15 min usually close to 1pm. Then you can capture traffic when the slowdown is observed (you can use Wireshark ring buffer feature if you don't know the time of next occurence). And after, if you find exactly this stream is causing your slowdown, then will be the time to dig deeper to find what proccess starts the stream.
1) This has happen intermittently
2) It lasted for 10 minutes
Thanks so much for the calculations, I will also analyze what might have trigger this. I also took a look under Conversation and found this to be the 2nd highest bytes count during the capture. I also attached the conversation in the questions.
Another quick question for this port 9001, I understand it's network traffic and directory information but are we able to tell what is going on from each packet ?
Can I ask what does *16 for the first received data is for ?
Could you please clarify you question, I don't understand what you mean.
sorry i mean this portion why would you multiple 16 firstly and then later add 619 ?
(1506*16 + 1506(unseen) + 619)
I just looked at your first screenshot and calculated Byte sum of all packets (frames) came from node with IP of 5.135.184.158. There are 16 packets of 1506 Bytes each + 1 unseen packet of 1506 Bytes + one packet of 619 Bytes. I didn't count the first packet of 619 Bytes because this is our 'relative zero' time moment.
But this is nothing special, you can just build I/O graph in Wireshark and do not do all this stuff.