Hi everyone. I have a persistent problem between my local machine and an external HTTP server. Everytime I try to download a page the connection resets and I have to retry with the remaining bytes. In wireshark I see TCP dup acks, retransmissions, and RST for every segment! Can somebody help me to debug it? https://www.cloudshark.org/captures/7af8a5c691c7 Thanks a lot! Hugo asked 12 Dec '16, 11:11 huguei retagged 20 Dec '16, 20:08 Philst |
6 Answers:
As usual for "hard to solve” problems, this one involves a combination of behaviours in various devices. RELEVANT OBSERVATIONS:
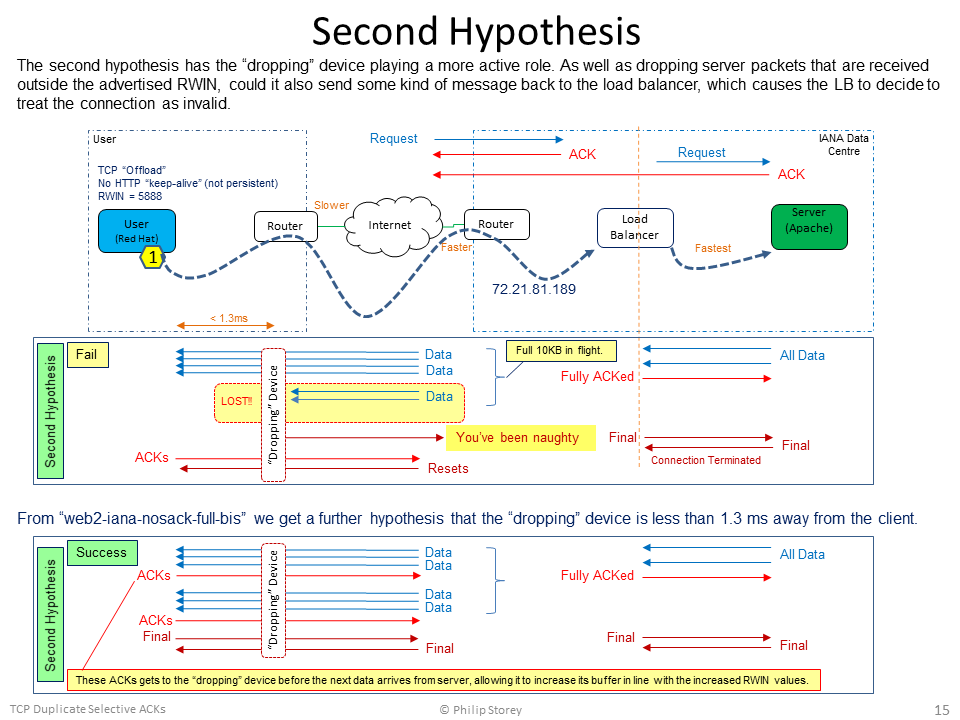
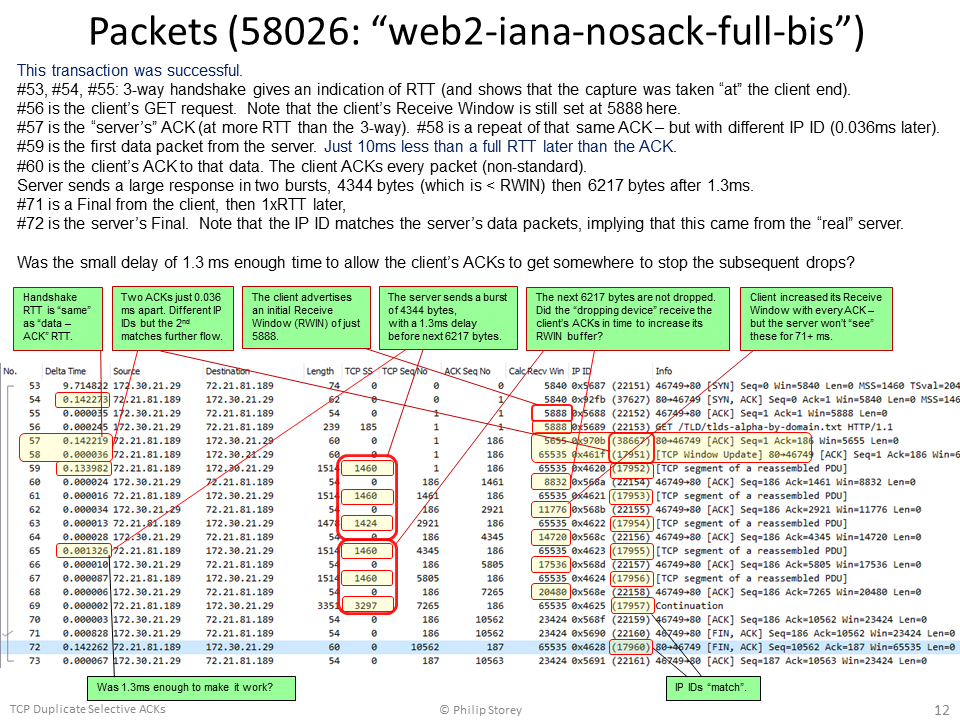
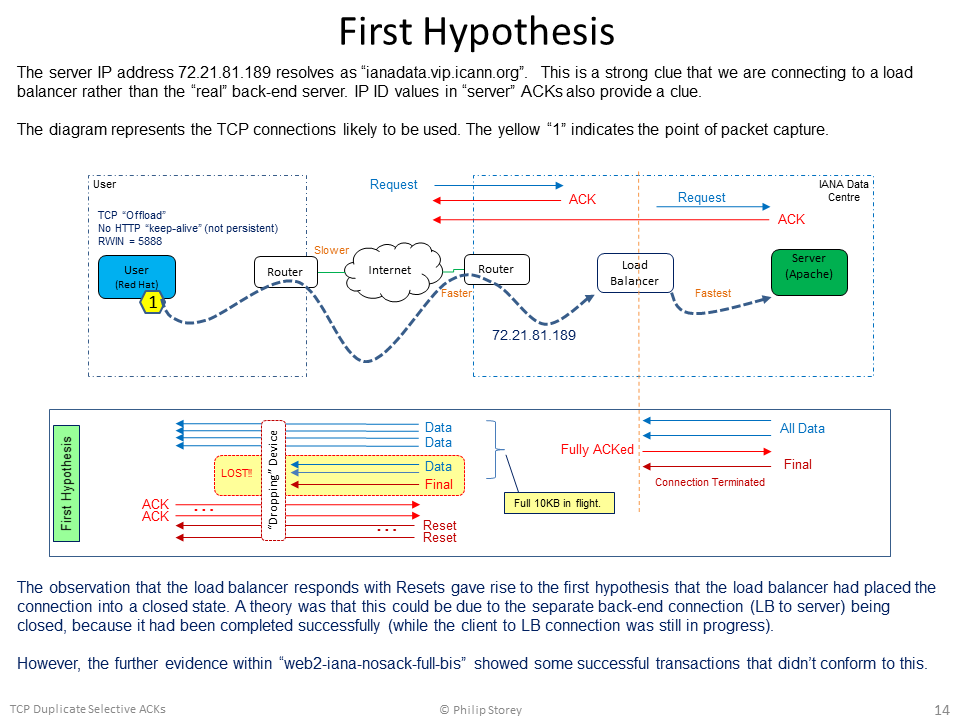
HYPOTHESES: A. The TCP connection from the client ends at the load balancer. A different connection is made from the load balancer to the “real” server. B. The first “server” ACK at the start and the final Resets all originate from the load balancer. C. The second ACK and all data packets originate from the “real” server. D. The real server sends the full response to the load balancer very quickly. E. The load balancer buffers the full response and takes responsibility for delivering the data to the client. F. The load balancer is ignoring the client’s Receive Window value of 5888 and transmitting the full 10KB response in one large burst – having 10 KB of “packets in flight”. Could the load balancer be using the Receive Window value in the client’s SYN packet rather than the client’s GET packet, then applying the client’s Windows Scale factor (x 128)? G. A device in the path is dropping packets that exceed the client’s Receive Window (but can “catch” one or two packets in excess). We’ll call this the “dropping device” and it could be a router, firewall, etc. H. From “web2-iana-nosack-full-bis” we can guess that this “dropping device” is within 1.3 ms of the client (i.e., an RTT of less than 2.6ms). I. The failed and successful transactions seem to indicate that the load balancer knows when the “dropping device” has dropped packets, because only then does it enter the “Reset everything” state. If the “dropping device” notifies the load balancer, what form might such a notification take? ICMP? Reset? The first hypothesis was related to the separate connections between the client-load balancer and then load balancer-server. However, the additional capture file uploaded by @huguei, "web2-iana-nosack-full-bis", contained successful transactions that provided evidence against it. Just for information and discussion, I've included the diagram for this first hypothesis at the end of this post. The second hypothesis is now the one I believe to have the most chance of being closer to the truth.
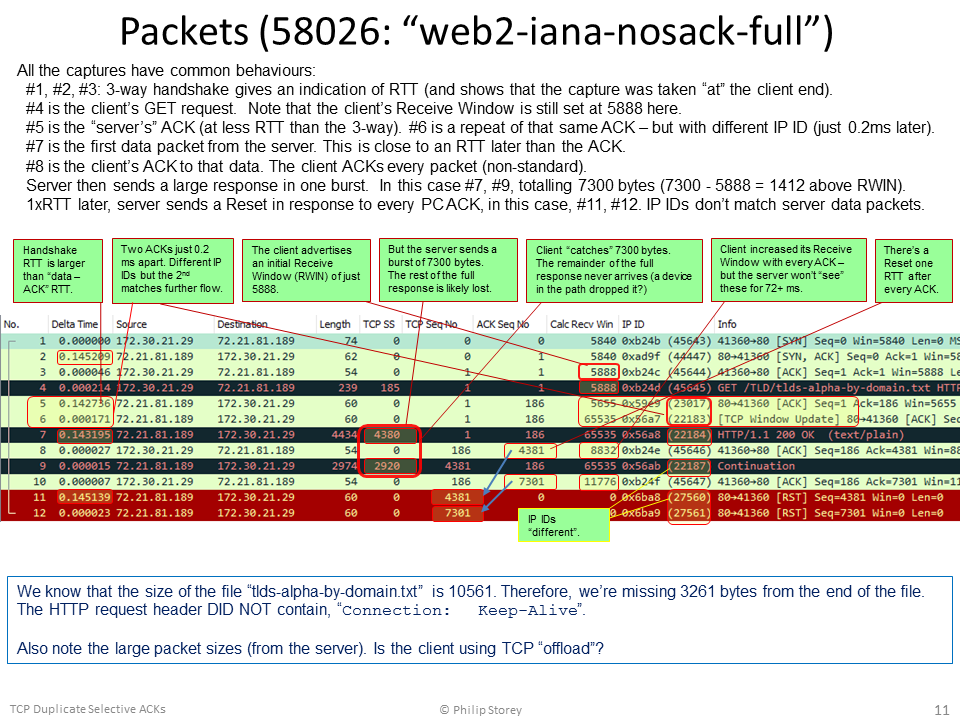
OTHER OBSERVATIONS: The HTTP header information tells us: The HTTP header does not ask for persistent connections, that is, does not contain: MORE QUESTIONS:
POSSIBLE FIXES OR WORKAROUNDS: The apparent “root cause” is that the server (load balancer) appears to be ignoring the client’s advertised Receive Window of 5888 bytes. It is transmitting the whole response of 10 KB in a single packet burst. The correct fix for this would need to be made at the IANA server or load balancer. We don’t have the ability to do anything at the server/load balancer end. All we can do is try some configuration changes at the client:
PROBLEMS AT THE IANA SERVER END: Apparently, the load balancer and/or server appears to be ignoring the client’s advertised Receive Window and transmits a burst of in-flight data that significantly exceeds it.
Apparently, both the load balancer and server appears to transmit their own ACK to the client’s GET request. We observe both ACKs arriving at the client.
We observe an unnecessary retransmission of the last smaller data packet of the response (when SACK is enabled). This arrives just 10ms or less after the original. It occurs for different files retrieved from the same site.
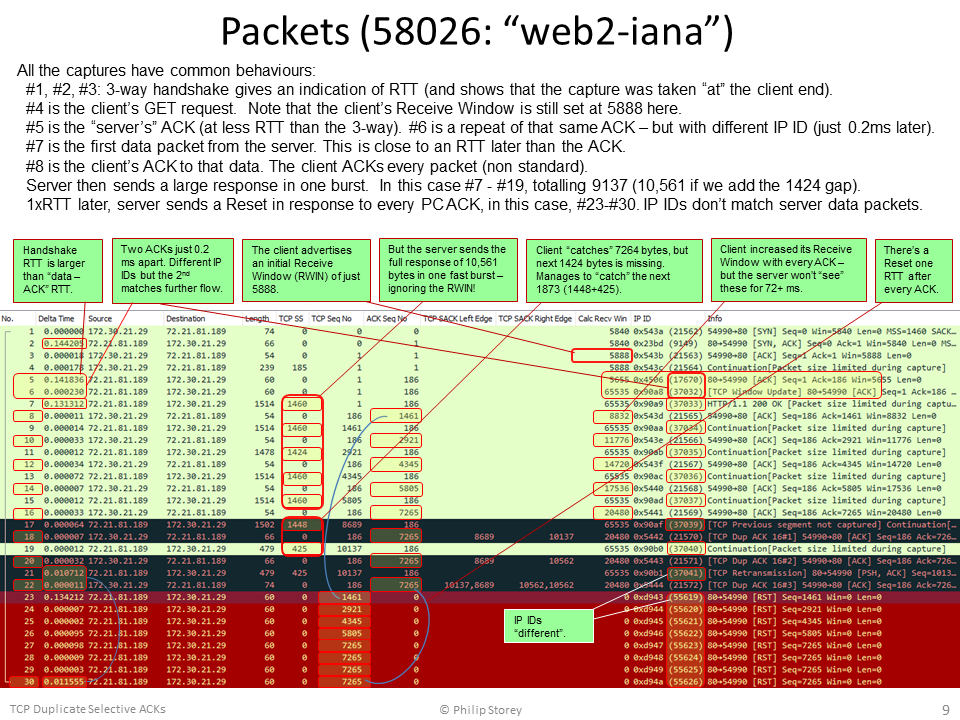
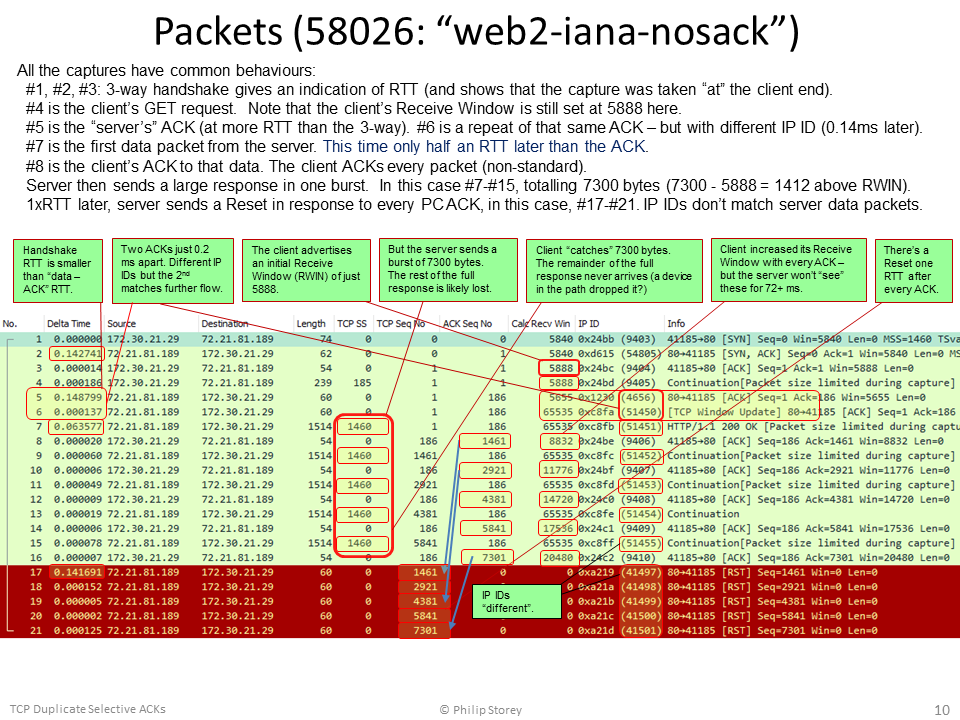
WIRESHARK OUTPUTS Here are the Wireshark packets lists, with notations, for each of the capture files:
Finally, the diagram for the First Hypothesis:
answered 17 Dec '16, 22:31 Philst edited 19 Dec '16, 14:38 I've just updated the post to add another possible reason for the load balancer to misbehave. Could the load balancer be using the Receive Window value in the client’s SYN packet rather than the client’s GET packet, then applying the client’s Windows Scale factor (x 128)? (18 Dec '16, 18:44) Philst It seems images are lost with the new site. They're still on: https://osqa-ask.wireshark.org/upfiles/58026-1.png https://osqa-ask.wireshark.org/upfiles/58026-2.png https://osqa-ask.wireshark.org/upfiles/58026-3.png https://osqa-ask.wireshark.org/upfiles/58026-4.png https://osqa-ask.wireshark.org/upfiles/58026-6_oCTdshG.png (27 Dec '17, 09:53) huguei |
Building on the other answers, there must be something in the path reacting to your all of your ACK packets with a TCP/RST. I just tried connecting to the same server and did not have the same issue. I assume our paths towards the server are different, but the same in the last part, so it must be something in your packets. I closely examined your packets and see that all the incoming packets have Do you have a QoS policy in your network in such a way that packets leave your network with DSCP markings? Maybe there is a device near or at IANA that does not like your markings after the 3-way handshake. answered 15 Dec '16, 04:38 SYN-bit ♦♦ 1 I did the test to download http://data.iana.org/TLD/tlds-alpha-by-domain.txt from a Windows 7 client using Firefox. There was no DSCP marking at all. Then I did another test to send out packets with DSCP AF11 marking (from a windows XP client using IE). The returning packets did not have any marking. It could be that the markings set by me were cleared somewhere on the path. But unluckily the problem could not be reproduced :( here is the capture made with AF11 marking -> https://drive.google.com/open?id=0B7Io9WiIN49VbmhiS0psNXIyaEE (16 Dec '16, 01:32) soochi |
The client seems to have a bug in the SACK implementation. 1424 bytes (segment 7265-8689) got lost after frame #16. First duplicate acknowledgement is issued for this missing block at frame #18 which also selectively acknowledges bytes from 8689 to 10137. Second duplicate acknowledgement is issued at frame #20 which again selectively acknowledges bytes 8689 to 10562. Once the frame #21 arrives third duplicate acknowledgement is transmitted which has 2 SACK blocks 8689 to 10562 and 10137 to 10562. Even if these segments are contiguous they are represented as 2 different blocks. answered 12 Dec '16, 12:09 soochi Thanks soochi! However I disabled sack in kernel and the problem persists: https://www.cloudshark.org/captures/eef50236731a :( (13 Dec '16, 05:31) huguei 1 Check IP ID field - it's different in RST packets. It looks like another device is sending these RSTs. Increasing TCP Seq of RSTs tells us that they were sent in response to every our ACK being sent after 200 OK HTTP server reply. (13 Dec '16, 05:57) Packet_vlad It could be something from the application which triggers the reset. It seems that the server resets all the segments which it send for some reason. Can you provide a trace where the application layer data is also visible. (13 Dec '16, 13:26) soochi Yes, here it's with full packets: https://www.cloudshark.org/captures/f7af91207479 Application is curl, but happens the same using wget. (14 Dec '16, 10:53) huguei |
Frame #21 is a retransmission of #19 - which arrives just 10.47ms later. There is no apparent indication of why this data is retransmitted. Frame #22 is not just a SACK, it is a D-SACK (Duplicate SACK) which is an extended way of using the SACK mechanism to report that an unnecessary duplicate data has been received. This extension functionality is documented in RFC 2883. The Resets appear one RTT after the client sends the D-SACK. My guess would be that the server doesn't understand D-SACKs at all and issues the Resets in response to this one. The RFC specifies that the duplicated data should be in the first SACK block. This is correct in this case, the first SACK block is the sequence numbers for #19 and #21. The second SACK block is the larger range that is still being selectively ACKed (the gap between #15 and #17). Disabling SACKs would be a workaround for this. The "proper" fix would be to stop the unnecessary retransmissions. Note that #21 (IP ID = 37041) is a genuine retransmission of #19 (IP ID 37040). The RTT seems to be just under 142ms but the Resets appear just 134ms after the D-SACK. Perhaps Packet_Vlad is onto something? answered 14 Dec '16, 02:57 Philst edited 15 Dec '16, 18:36 Thanks Philst. I disabled SACK and it seems to have solved the retransmissions, however the resets are still there :( https://www.cloudshark.org/captures/eef50236731a So it seems the culprit is some middlebox resetting the connection. Thanks! (14 Dec '16, 09:26) huguei @Philst Thanks for the explanation with regards to extended SACK. what is the logic behind calculating the delta time from #22? should it not be the total time from #9? because the relative sequence of 1461 is being reseted at #23 which happened after 145ms. (15 Dec '16, 01:55) soochi 1 You're absolutely right @soochi. There is a Reset in response to every one of the client's ACKs. There are 8 ACKs and 8 Resets. #23 is a response to #8, #24 to #10, #25 to #12 .... #30 to #22. The sequence numbers in the Resets match to the ACK sequence numbers in the ACK packets. The RTT between those pairs is as you'd expect. This pattern is the same in the other captures too. I'm very unhappy with my answer because I was far too hasty - and didn't give it enough thought before posting the answer. I'm especially disappointed in myself because @huguei had already stated that he ran a test after disabling SACK. That nullifies my "guess" straight away. The time between the D-SACK and Resets doesn't mean anything. From now on, I'm not going to answer any question unless I've:
Now that I've looked at all 3 of the available capture files, I'm working on a hypothesis. I'll post a separate answer once I've solidified my thinking. The "nosack-full" file is likely to yield the best results but it is good to have more than one sample to cross-check ideas. (15 Dec '16, 15:00) Philst Thanks @Philst ! :) all your answers are valuable to me. I did another test, uploaded here https://www.cloudshark.org/captures/3e5241cb876c This time it was without SACK, and:
Hope it helps to confirm your hypothesis! (16 Dec '16, 06:38) huguei why does the trace have packets larger than MSS. okay could be offloading, then why does the server only send reset to those segments in the trace. I noticed this a couple of time in the traces. example from trace web2iana-nosack-full-bis.pcap: #30 carries 2852 bytes of data, it has ID of 47601. #32 the next frame from server has ID of 47603. In this case i believe that the ID 47602 is missing because of offloading. Then why are the resets only sent for sequences 1461, 4313, 5761 and 7221 and interestingly these are having ID of 60014-60017. I cannot imagine of a reason for this :( (16 Dec '16, 13:18) soochi Thankyou @huguei, I really appreciate your comments. I'm nearly ready to post a new answer. The long version is quite a story and I need to finish some diagrams to include with it. To answer your question though. Yes, the new capture does confirm my hypothesis. The clue to why the two of your new samples worked is that:
That last one is a valuable clue. Your homework is to work out what device is between 1ms and 1.3ms away from your client PC (i.e., RTT of 2ms to 2.6ms). My guess is a low cost router. Now for @soochi's questions. The Resets are always in response to the client's ACKs, you'll see that the number of Resets always matches the number of client ACKs. The sequence numbers in the Resets match the ACK sequence numbers in the ACKs. In your example of data packet #30, the ACK for that is #31 (ACK Seq 4313) and the corresponding Reset is #37 (Seq 4313). The pairings are (#29, #36); (#31, #37); (#33, #38); (#35, #39). The IP IDs of the Resets are always different too, because I believe they are originating from a load balancer, not the "real" server. Try a DNS lookup for "ianadata.vip.icann.org" Hopefully it won't be too long before I post my new answers. (16 Dec '16, 19:19) Philst showing 5 of 6 show 1 more comments |
(Sorry this isn't an answer but I wanted to post my comment here to let everybody knows!) I tried to change the initrwnd but is not possible in my server (CentOS 5.11, with a 2.6.18 linux kernel). So I tried the second workaround of @Philst, disabling the TCP window scaling option, and it works! I can download the entire page in a single connection every time I test it. Here's a capture with 3 attempts: https://www.cloudshark.org/captures/eb6a42c86853 So, I just wanted to thanks everyone for your time and help... and @Philst for its great answer. I'll surely keep debugging it and let the server side knows their load balancer problem! answered 19 Dec '16, 06:21 huguei And to add more information, disabling tcp_timestamps didn't work, neither the Connection: Keep-Alive header. (19 Dec '16, 06:26) huguei 1 I think it should also work using range headers. lets say just by downloading in 5000 Byte blocks. can you try this too. (19 Dec '16, 06:44) soochi 1 That's good news @huguei. In your latest "working" capture file, we can see that you now receive the 10 KB response in two separate bursts (so it costs you an extra round trip of 143 ms). Your initial Receive Window is 5840 (advertised in #1, #3, #4) and the server sends 5804 bytes in the first burst (#7, #9, #11). Your ACKs (#8, #10, #12) step up your RWIN to 14600, but that doesn't really matter because you receive the last 4757 bytes, one RTT later, in the second burst (#13 - which would have been two packets on the wire). You can re-enable SACKs now - and you really only need to disable Window Scaling when going to the IANA website. It would have been interesting to see if disabling your "TCP Offload" function had any effect. It would have been nice to confirm whether that was the "dropper". Without the drops, you probably would never have had the error in the first place. Each of your ACKs would have made room in your receive buffer for more data, just in time before the next packet arrived. I wonder if this may have been keeping the problem hidden for other IANA users? I'm glad I could help. It was a nice little exercise and I think it will become an entry on my blog one day. (19 Dec '16, 15:28) Philst I tried disabling "TCP offload" and didn't work ("ethtool -K eth0 tso off", if that's what you mean!) My default router is <1ms RTT away. So it has to be something upstream. I'll keep hunting for it! (20 Dec '16, 07:53) huguei I noticed that I said, "between 1ms and 1.3ms" in my comment - but I really meant "less than 1.3 ms". Apologies for that. There just had to be enough time for the client ACK to get to the "dropper" before the next data packet(s) arrived from the server. We saw a 1.3ms time delay between the server data packets - meaning that the "dropper" must be closer to the client than that. So the "dropper" could be your local router, your WAN router, a firewall, intrusion detection device, etc. Anything that would not like seeing server data packets exceed the advertised client Receive Window. Note that the "dropper" is a symptom of the real problem, not a problem itself. (20 Dec '16, 16:29) Philst |
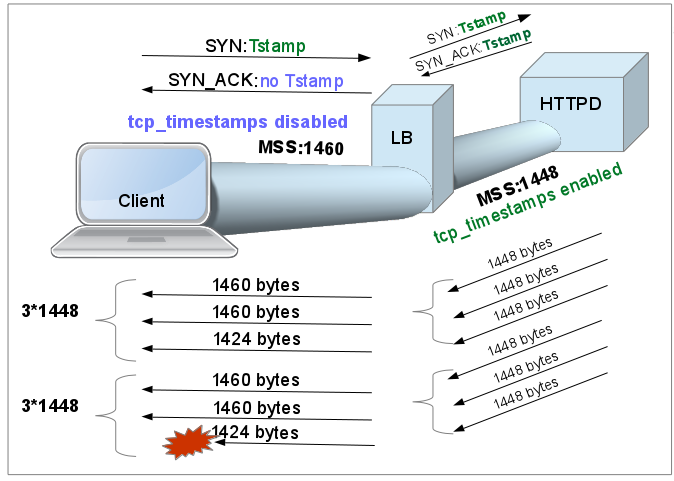
I think the problem is due to different MSS sizes negotiated between the client and a load balancer (1460) and the load balancer and the server (1448) and the load balancer not very robust in handling You can try disabling tcp_timestamps via Here is the picture that kind of explains what is happening in the first trace you provided. The three way handshake (that we see in your trace) is Linux client (RHEL) asking for timestamp option but the 'server' does not allow it. So the net MSS on this TCP session is 1460 bytes. answered 17 Dec '16, 05:48 mrEEde edited 17 Dec '16, 08:39 How could you interpret from the capture about the MSS negotiation between the load balancer and server? and why do you think that disabling time stamps should resolve the issue? I interpret that the server does not support time stamps and thereby it ignores that tcp option. (17 Dec '16, 07:48) soochi That is quite a good observation. I was using the first two "server" ACKs and the different IP IDs of the first ACK and Resets to infer the idea that there is a load balancer with separate back-end TCP connection to the "real" server. This observation adds to the evidence for that. (17 Dec '16, 21:43) Philst It was actually your comment Philst that sent me down that route inspecting the length of the arriving - and missing - packets. So good collaboration on this one (17 Dec '16, 22:16) mrEEde After reading throuh Phil's hipotheses I'd say increasing the initialrwin will resolve this issue. I'm using RHEL7 and my initial windowsize offering is 29200 and I don't have the problem getting to this site. Here is how to do it. https://blog.habets.se/2011/10/Optimizing-TCP-slow-start ip route change default via x.x.x.x initrwnd 20 (17 Dec '16, 23:18) mrEEde |

i have no idea why the server should retransmit (at #21) bytes 10137 to 10562 in such short time interval (0.010 ms). The iRTT is 144 ms.
any ideas?