Hello, I have one question, I have installed Wireshark 2.2.4 on Ubuntu. I have captured packets with MCS 9, QAM 256, 802.11 AC in 5 GHz. In the main Window of Wireshark the data rate are not displayed, also it isn't possible when I will filter on I/O-graph this device with wlan_radio.data_rate.
With best regards Mathias asked 09 Feb '17, 05:28 Hyrrican |
3 Answers:
So the problem is how the Data rate is being defined by Wireshark for 11ac devices.
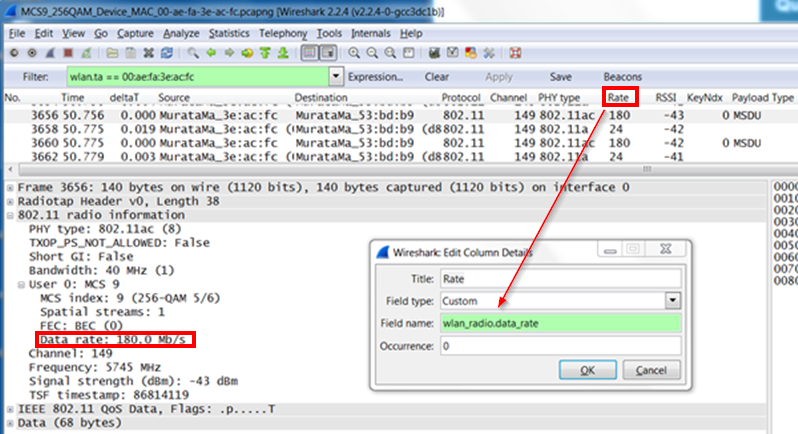
Therefore, the VHT (11ac) rates are not being displayed under the typical data rate. To view the 11ac data rates, you can create a Custom Column field:
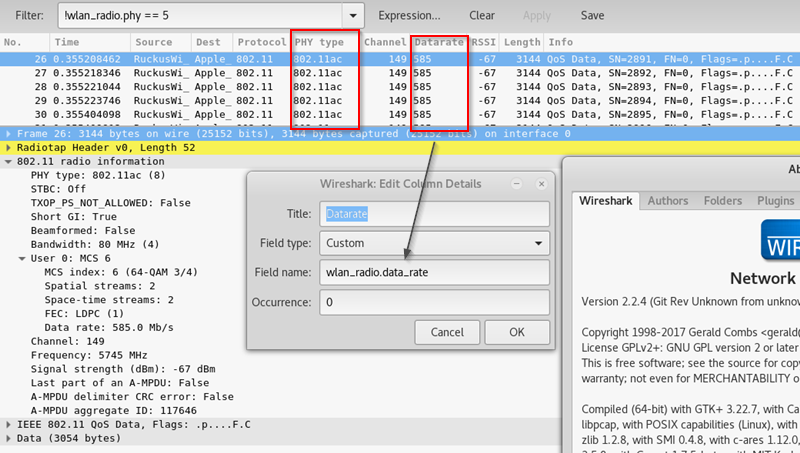
The new column should be displayed. answered 09 Feb '17, 10:41 Amato_C 1 I couldn't find that exact packet in the trace to compare, but it looks like on Windows it works as expected:
@Amato, I thought the whole point of the wlan_radio fields were to simplify the radiotap and other header information (I guess PPI, etc)? I much prefer this unified approach through the wlan_header for things like data rate as my columns are cleaner - in the ealry days I would need different columns for 802.11ac data rates, n rates, regular rates, and they would all be empty except for the one that matches the actual frame. Is there another purpose, or is your answer a workaround? Are there specific limitations to having a unified datarate field that covers the spectrum? (09 Feb '17, 13:44) Bob Jones @Bob Jones - Thanks! I forgot about the wlan_radio field. Yes it provides a much cleaner solution where a single column will provide all the data rate information regardless of the technology. However, the user must still create a Custom column field. For some reason the default 802.11 TX rate does not display 802.11ac rates. For example, if the user selects IEEE 802.11 TX rate for Type within Column Preferences, then 11ac rates do not display. Maybe a bug? (09 Feb '17, 16:58) Amato_C I can test your workaround on tuesday. I have selected IEEE 802.11 TX rate in Column Preferences. @Amato, I also see nothing in I/O-Graph for AC devices with wlan_radio.data_rate. Why it works on Windows? (09 Feb '17, 22:52) Hyrrican Your answer has been converted to a comment as that's how this site works. Please read the FAQ for more information. (10 Feb '17, 01:36) Jaap ♦ I tested on Kali Linux to see how 802.11ac frames will show with datarate. All seems fine here as well. I don't think the overiding factor is OS; indeed, I can get this field to show properly on any of Windows, Linux, or Mac OS X with either QT or GTK. Somehow the issue seems to be localized to your setup.
(13 Feb '17, 06:13) Bob Jones |
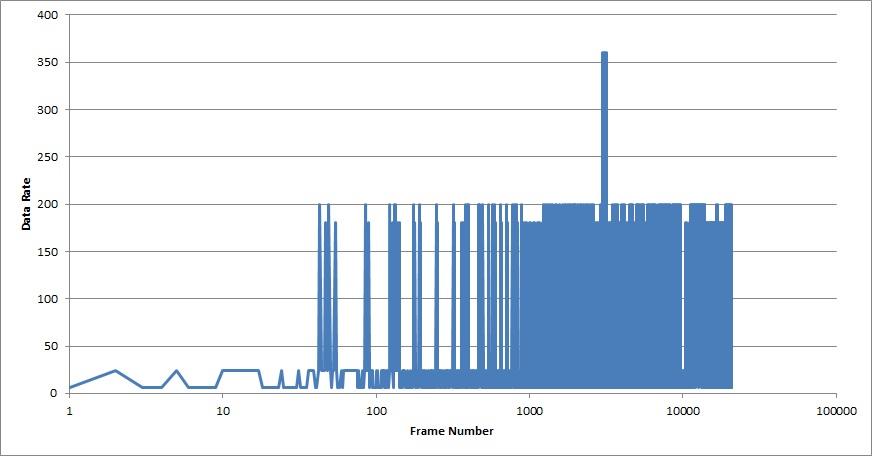
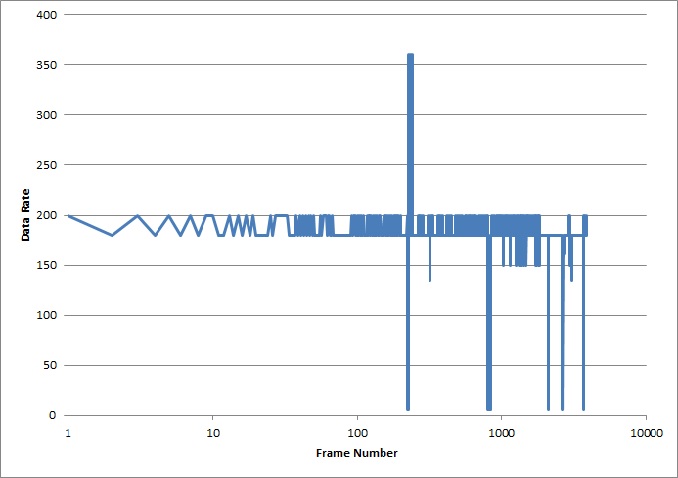
Note sure why wlan_radio.data_rate is not working on the I/O graph for Ubuntu. For post analysis, I prefer to use Tshark commands and convert the information into a CSV file. From there, I can make graphs and do whatever I need. For example: tshark -r c:\temp\test.pcap >c:\temp\test1.csv -T fields -e frame.number -e wlan_radio.data_rate -e frame.time_relative -E header=y -E separator=, This command will export a CSV file with 3 columns: Frame number, Data rate and Relative time. Then I can plot the frame number on the X-axis and Data Rate on Y-axis to get the following graph: The above graph has all frames (data, control and management). If I filter only the Data frames (QoS Data included) and then perform the same analysis, I get: Now that shows that most of the data rate is around 200Mbps with a spike of 360Mbps. But there are some very low rates of 6Mbps. Most of these are EAP exchanges (assuming rekeying here) but a few are Data frames. Hope that helps answered 10 Feb '17, 13:14 Amato_C Hi, I need a real time analyze of data rate or is it possible to set a marker? But I/O-Graph with MCS7 N-devices is possible with wlan_radio.data_rate, I have tested. But I will check tomorrow if your workaround with radiotap.vht.datarate.0 is possible for my situation. (12 Feb '17, 23:14) Hyrrican @Hyrrican - I am assuming you would like to view the WiFi data rate per frame. Is that correct? (13 Feb '17, 06:27) Amato_C Yes, I would like to see data rate per frame to see if something is wrong. (13 Feb '17, 11:51) Hyrrican @Hyrrican - I am not aware of how to modify the X-axis within Wireshark's I/O graph. It is by default set to time and I do not know how to modify the units to Frame Number. By having the X-axis set to time, the I/O graph will display the number of frames that contain a WLAN data rate (wlan_radio.data_rate). For a WiFi capture, all packets will have a data rate so that is not useful. If you use the VHT data rates (radiotap.vht.datarate.0) then the graph will display only VHT frames per time. Also not very useful. (13 Feb '17, 12:55) Amato_C
When I need this view I do one of two things:
(13 Feb '17, 13:20) Bob Jones |
You need to complete the Y-axis and Y-field areas: The Y-axis must be selected as Max, Min or Average. Then the Y-field would be wlan_radio.data_rate As for the differences between radiotap.vht.datarate.x, I am not sure. I was only able to find the following documents: https://www.wireshark.org/docs/dfref/r/radiotap.html https://raw.githubusercontent.com/boundary/wireshark/master/epan/dissectors/packet-ieee80211-radiotap.c Neither provide a very descriptive explanation. But looking at the Git hub repository, it "appears" that the difference is the number of spatial streams supported by the device?? datarate.0 = 1SS datarate.1 = 2SS etc... answered 17 Feb '17, 07:07 Amato_C @Amato_C The new question and your answer should be moved to a separate question. I can do the former, not the latter. If I move the question, can you repost your answer? (17 Feb '17, 07:09) grahamb ♦ But in this case I only can show all packets of all devices, I don't can filter with "and ip.addr ==" in Y field for a specific device. I need a graph for 3 devices separate. My question from upper screenshot is, why is the AC device with 200 Mbit/s in the graph lesser as from the devices with 150 Mbit/s? (17 Feb '17, 09:34) Hyrrican @grahamb = absolutely! I will repost the answer. @Hyrrican = Let's take up this conversation after the new question is posted. Also, if comment or answer has provided you assistance, can you accept the answer so others can benefit from this. Thanks. I work for Karma :) (17 Feb '17, 12:40) Amato_C I've moved the new question here. Please report answers and comments over there. (18 Feb '17, 02:07) grahamb ♦ |


Are you seeing this on the Qt build or GTK+ build or both?
You can determine which build you are using by Help / About. Then look for "Compiled with"
The difference: Qt = new build of Wireshark GTK+ = legacy build of Wireshark
My recommendation is try viewing the capture in BOTH builds to determine if it is specific to the build.
Can you share a capture in a publicly accessible spot, e.g. CloudShark?
It was compiled with Qt 5.6.1
Also i have tested with GTK+ 3.20.9 the same issue.
Capture is here in DropBox, the device MAC is in the name of the file: https://www.dropbox.com/sh/asyho7xsppwt6be/AAAgJTZBMzAmlJ7_tZEgU3Zia?dl=0